Našimi kurzy prošlo více než 10 000+ účastníků
2 392 ověřených referencí účastníků našich kurzů. Přesvědčte se sami
This manual refers to Conditional Formatting in Power BI tool, which works similarly to Conditional Formatting in Excel.
How to do it?
Use some of the table (not chart) visuals in Power BI Desktop.
Then click on some item placed in Values (like if you need to switch between sums, averages…). Click on Conditional Formatting.
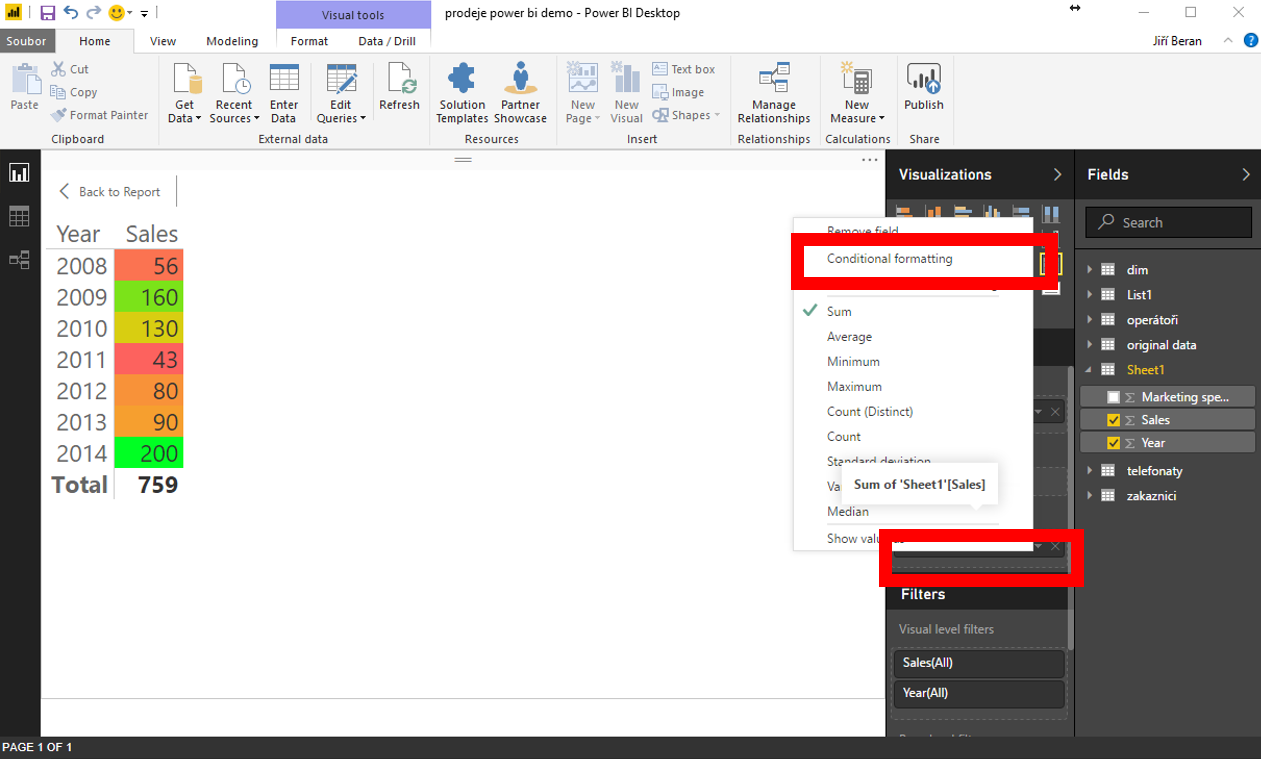
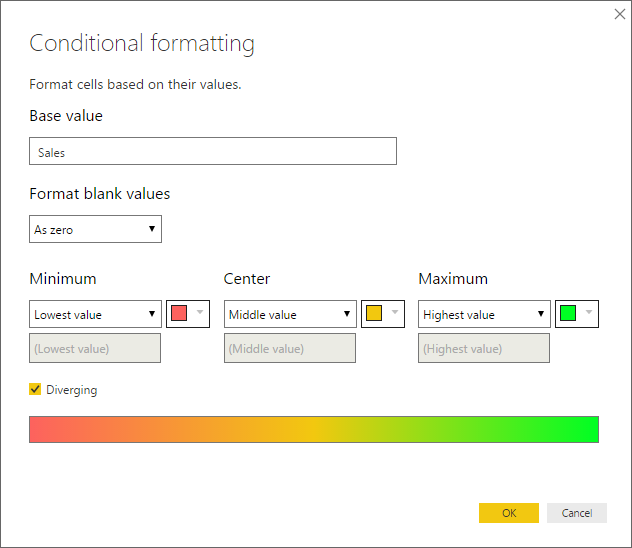
Set the color scale. Honestly, it is very simple so far – compared to Excel.
![]()
![]()
Pište kdykoliv. Odpovíme do 24h
![]()
© exceltown.com / 2006 - 2023 Vyrobilo studio bARTvisions s.r.o.