Našimi kurzy prošlo více než 10 000+ účastníků
2 392 ověřených referencí účastníků našich kurzů. Přesvědčte se sami
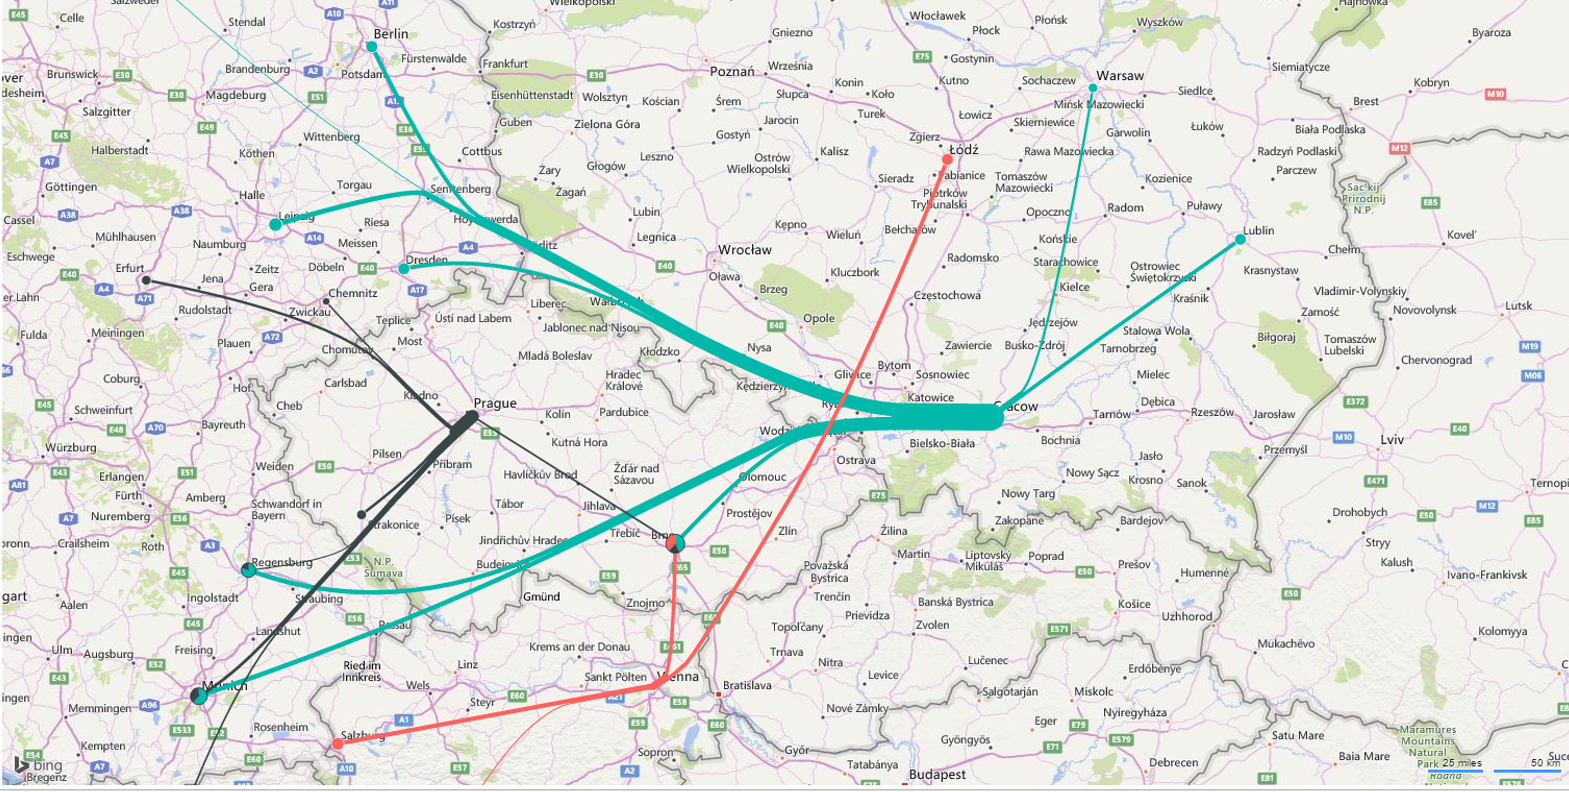
This article describes Flow map – custom visual in Power BI, enabling you to create images like this – schemes describing moving of something somewhere.
You can download it from here.
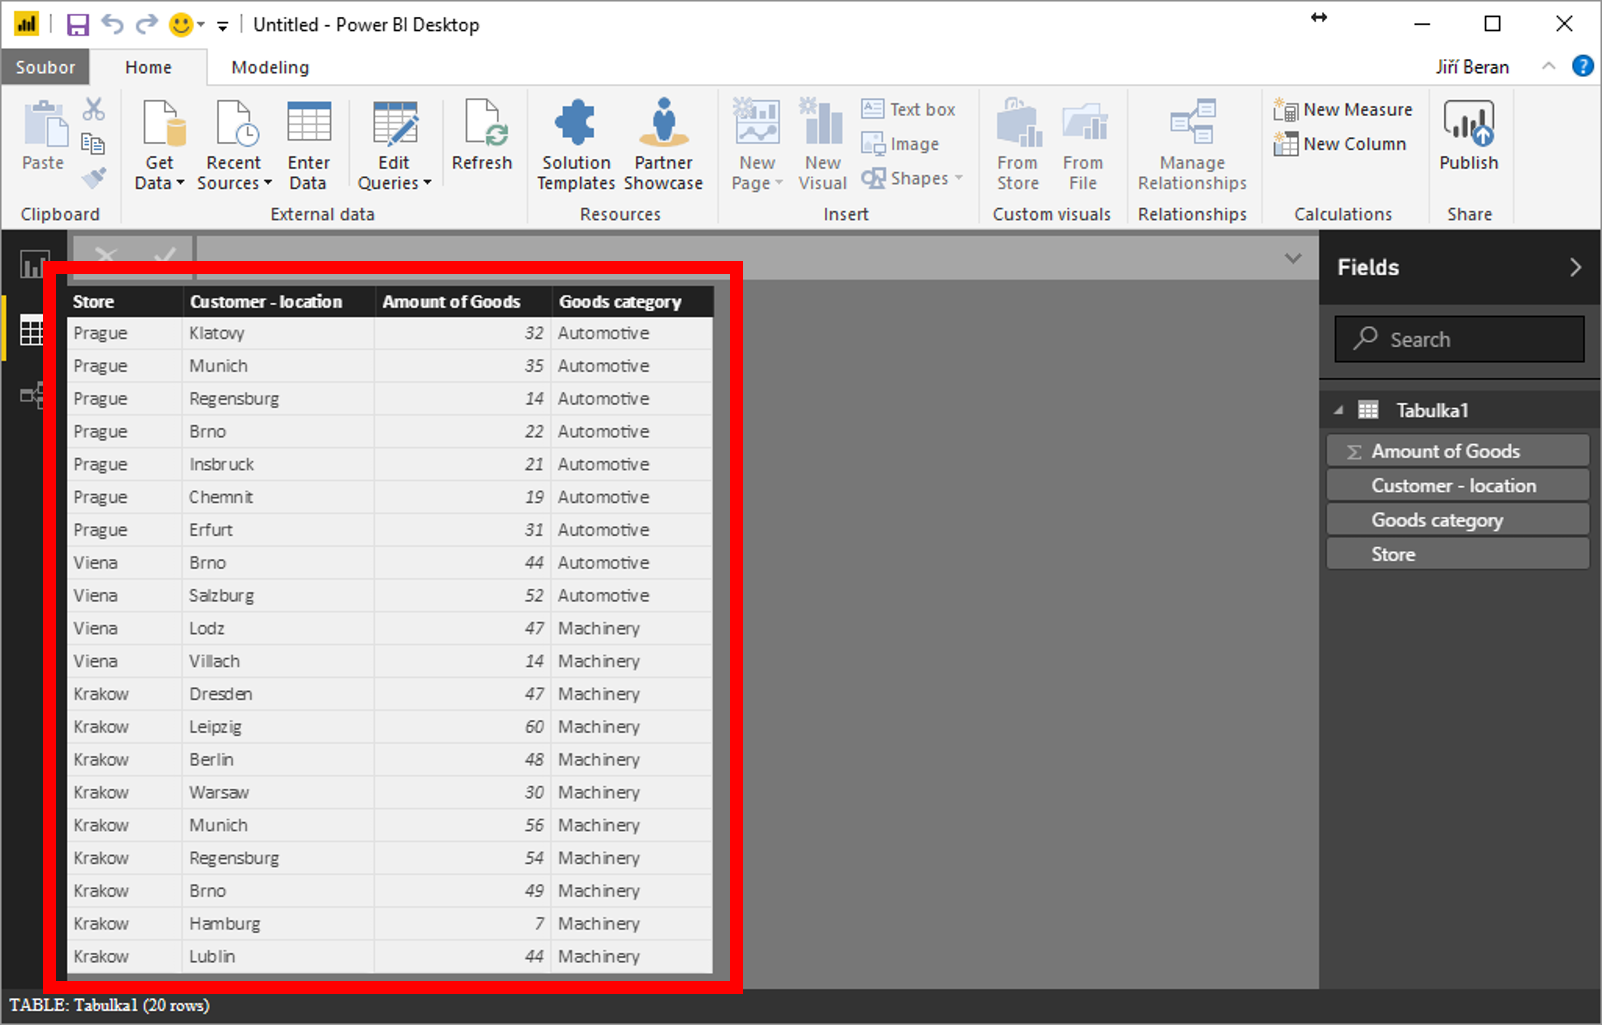
How to do it? We need some data containing origins of flows, ends of flows and amounts (widhts of lines).
Lets insert new visual and define what is what.
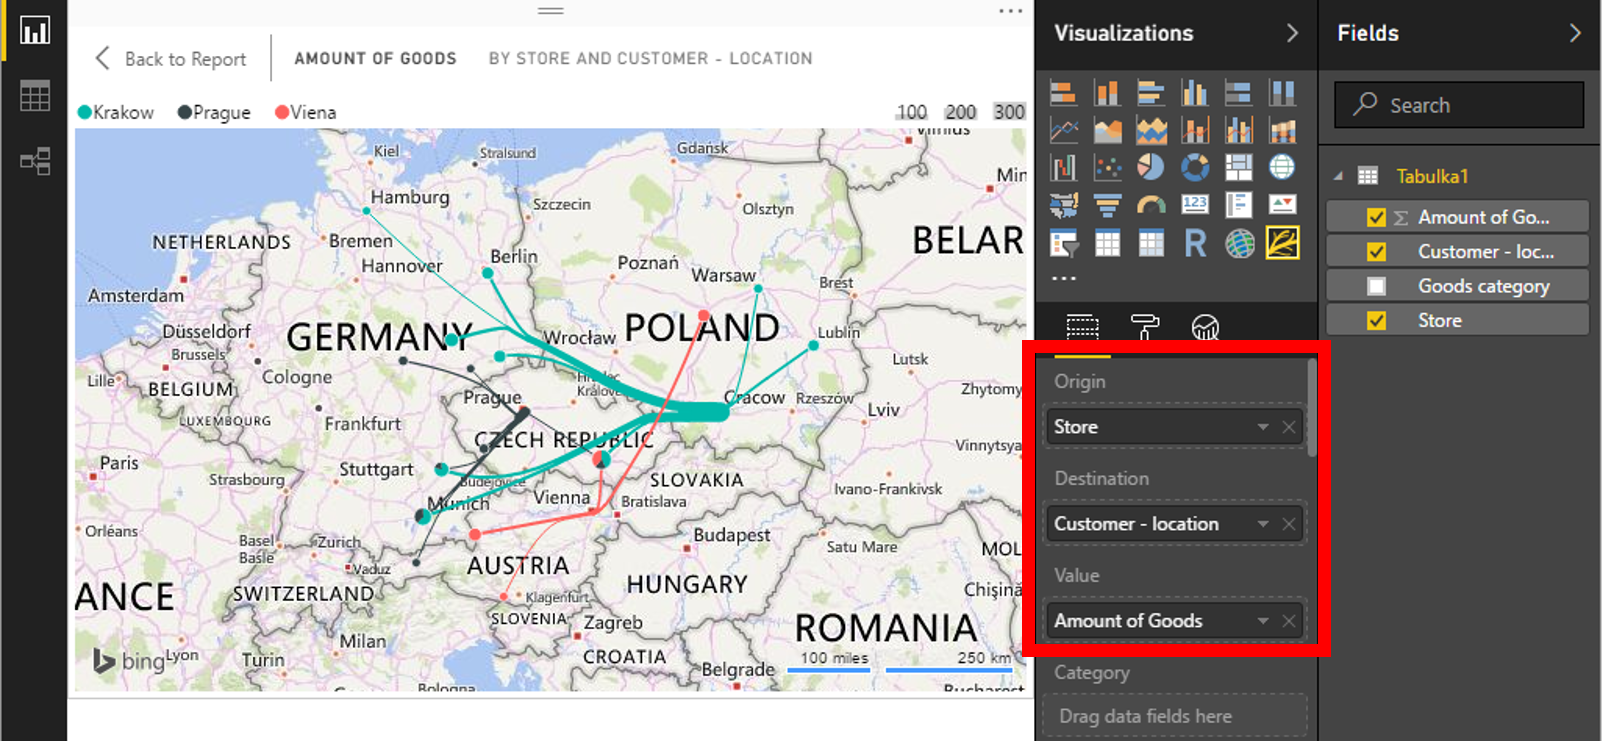
That´s all. Now just zoom to the right place on map – there is no need to cover all the world.
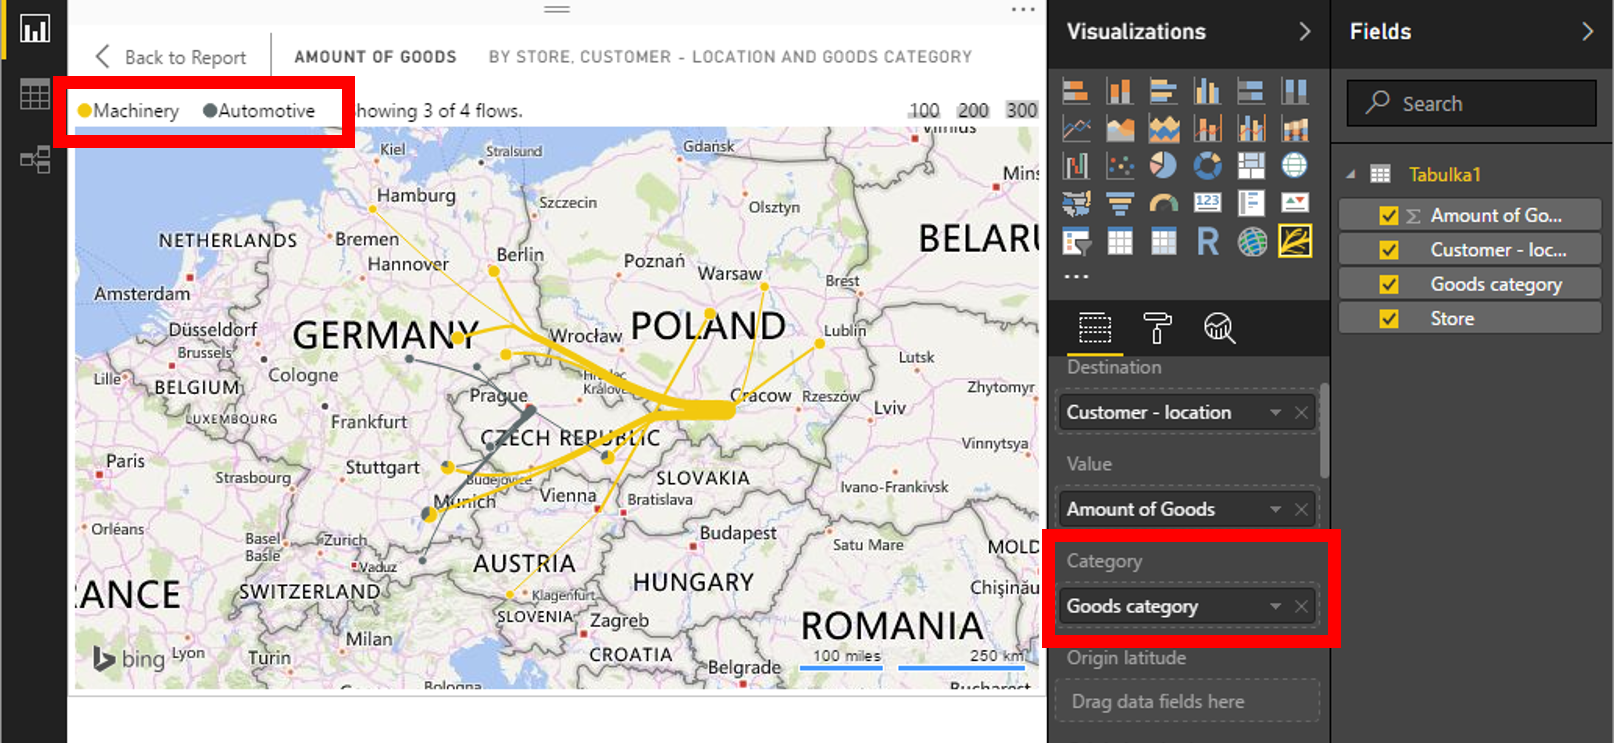
If needed, you can combine it with any filtering based on some column.
![]()
![]()
Pište kdykoliv. Odpovíme do 24h
![]()
© exceltown.com / 2006 - 2023 Vyrobilo studio bARTvisions s.r.o.