Našimi kurzy prošlo více než 10 000+ účastníků
2 392 ověřených referencí účastníků našich kurzů. Přesvědčte se sami
This is a short tutorial for SAP Analytics Cloud – describes, how to create the first real report.
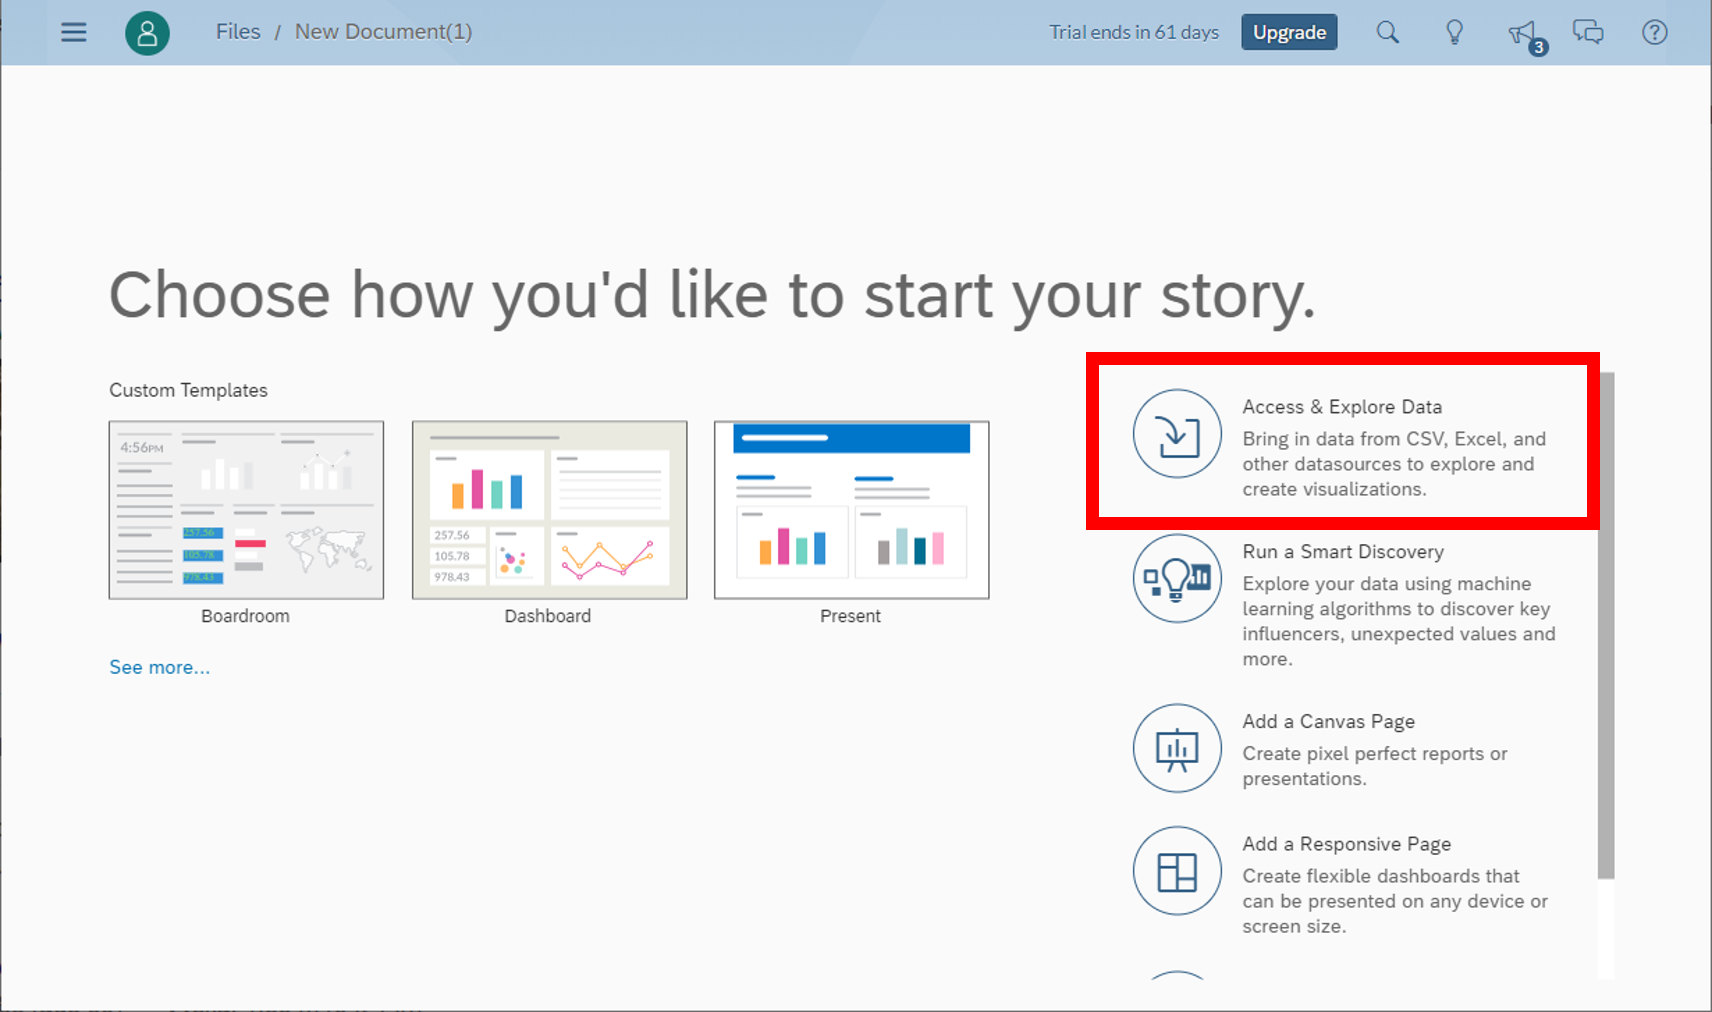
Go to “Story”.

Continue to Access and Explore Data.
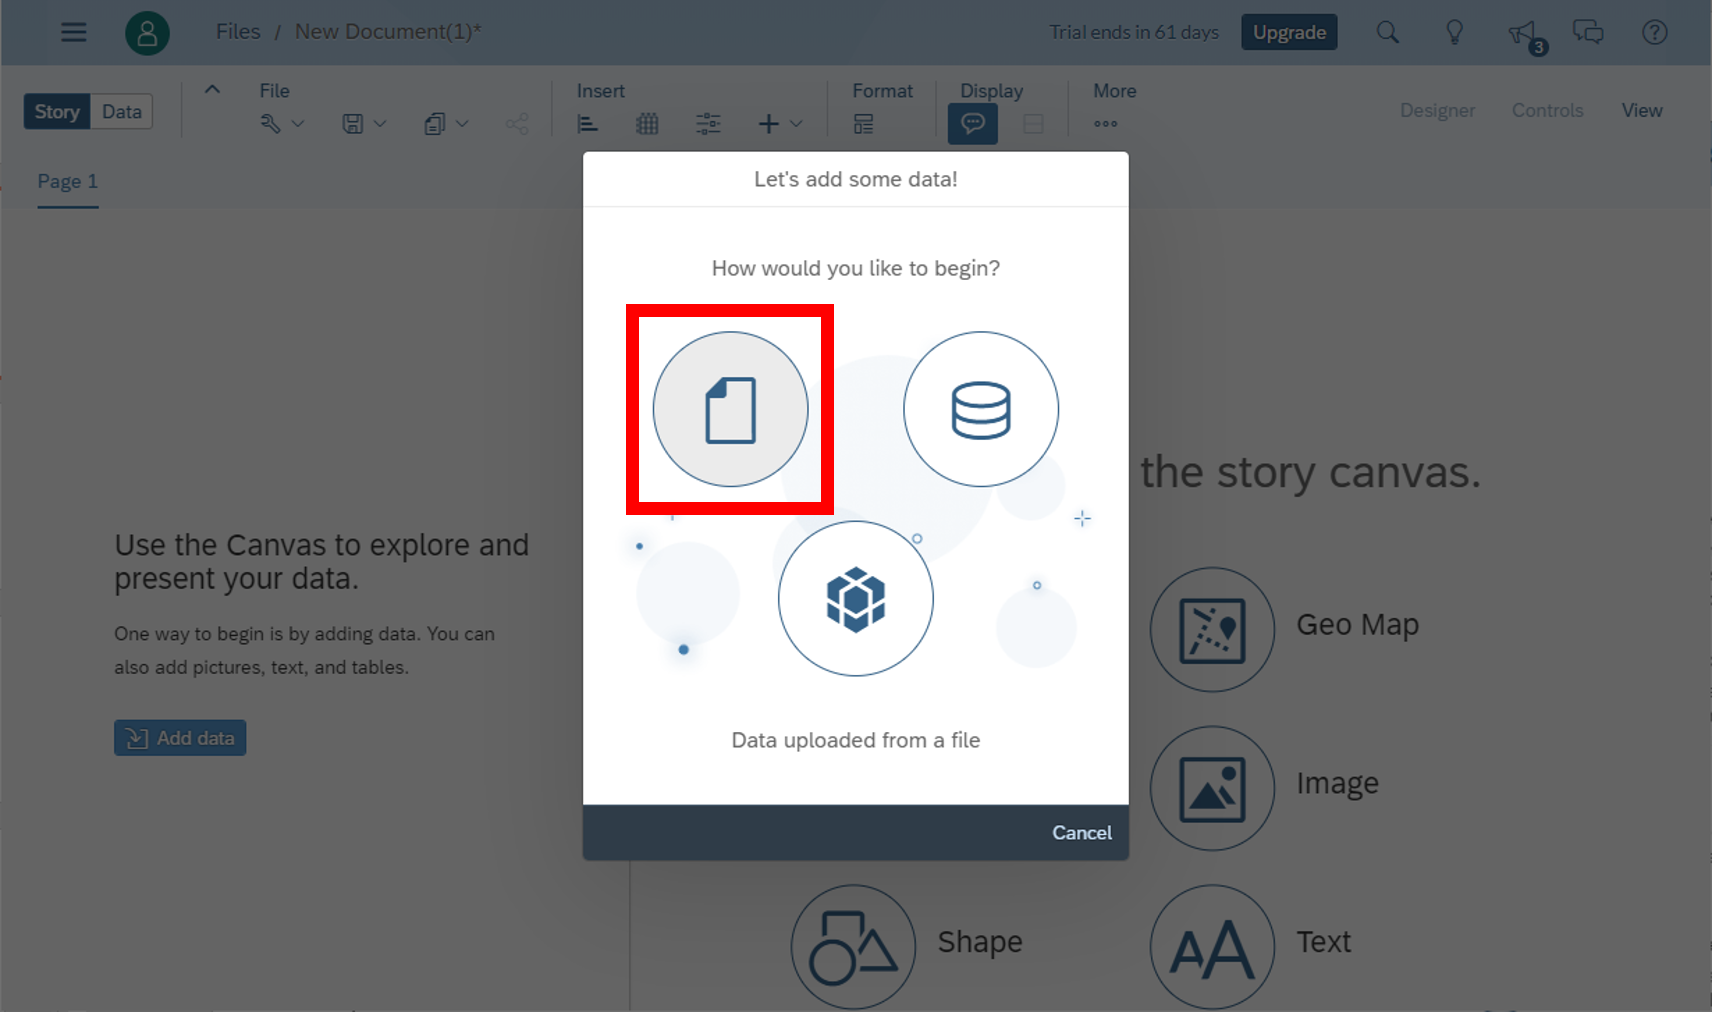
Use the the file data source.
Now there is a new table. We can modify the data, like remove column, filter, calculate…
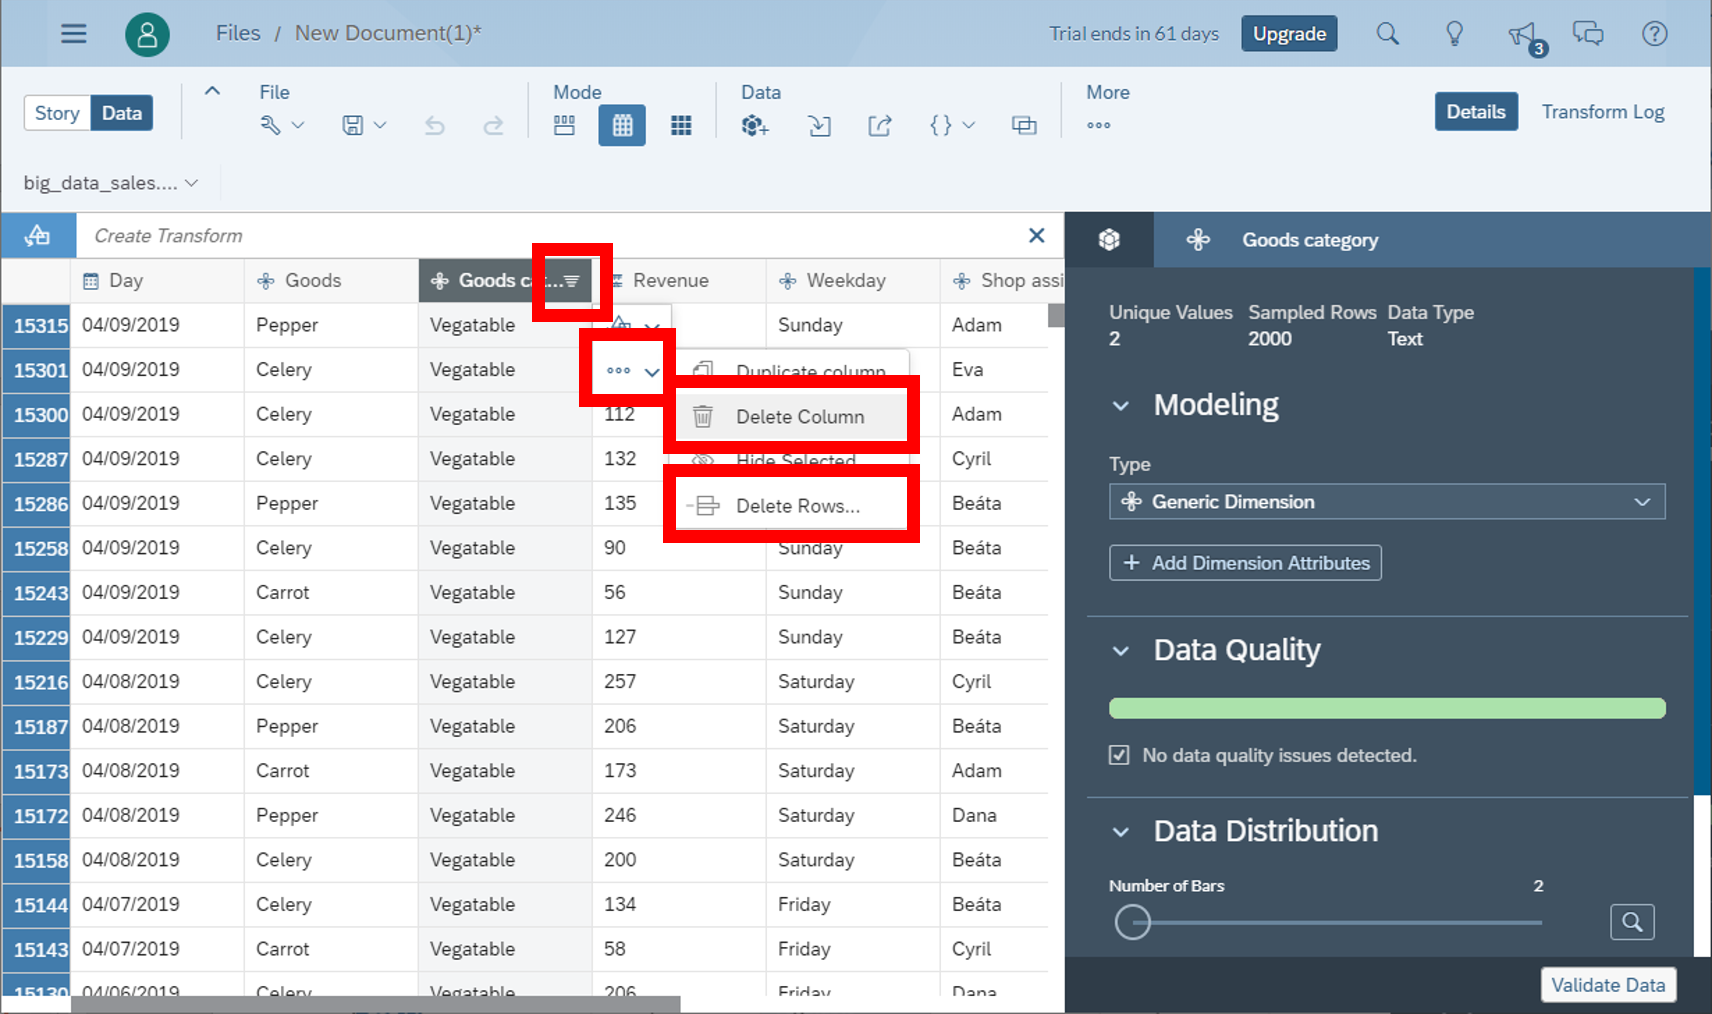
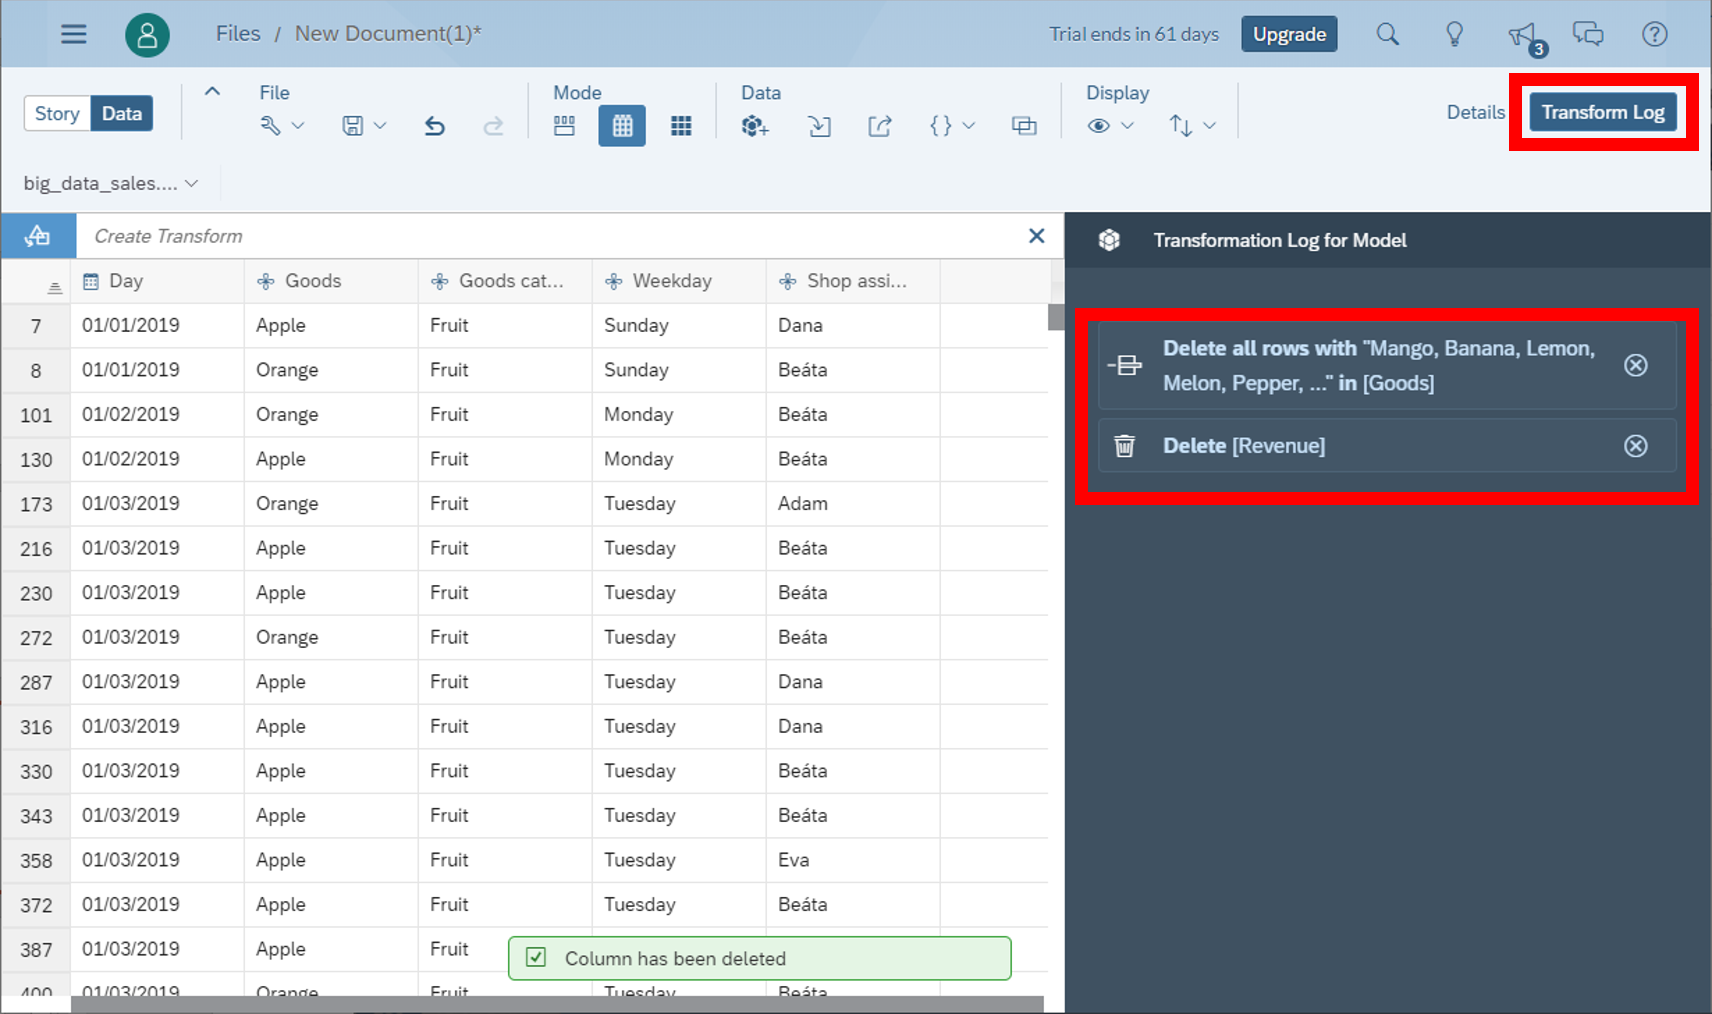
These actions create “log” – list of steps. This can be modified now or later.
Then switch, on the left top, to story, and create a chart. Add measures (values to calculate) and dimensions (items to group by).
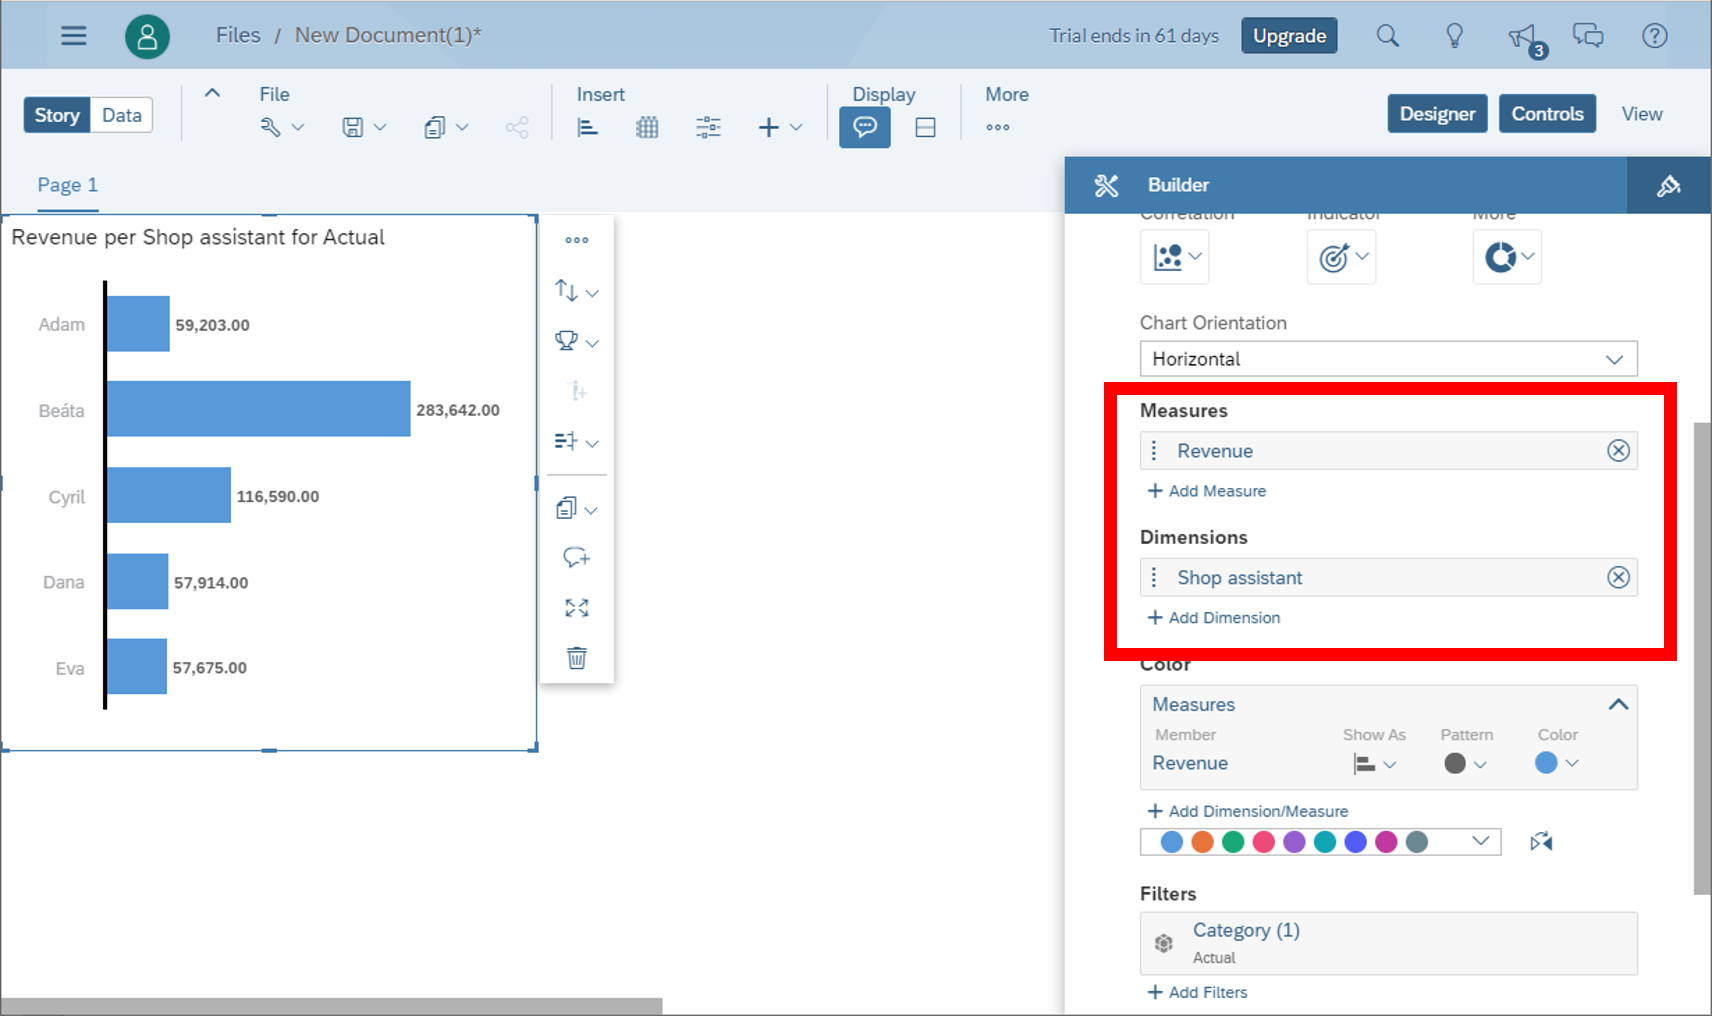
That’s all Folks
![]()
![]()
Pište kdykoliv. Odpovíme do 24h
![]()
© exceltown.com / 2006 - 2023 Vyrobilo studio bARTvisions s.r.o.