Našimi kurzy prošlo více než 10 000+ účastníků
2 392 ověřených referencí účastníků našich kurzů. Přesvědčte se sami
This (very simplistic) article describes what a dimension and a fact table are, how they differ from each other, and especially how to work with them in Power BI.
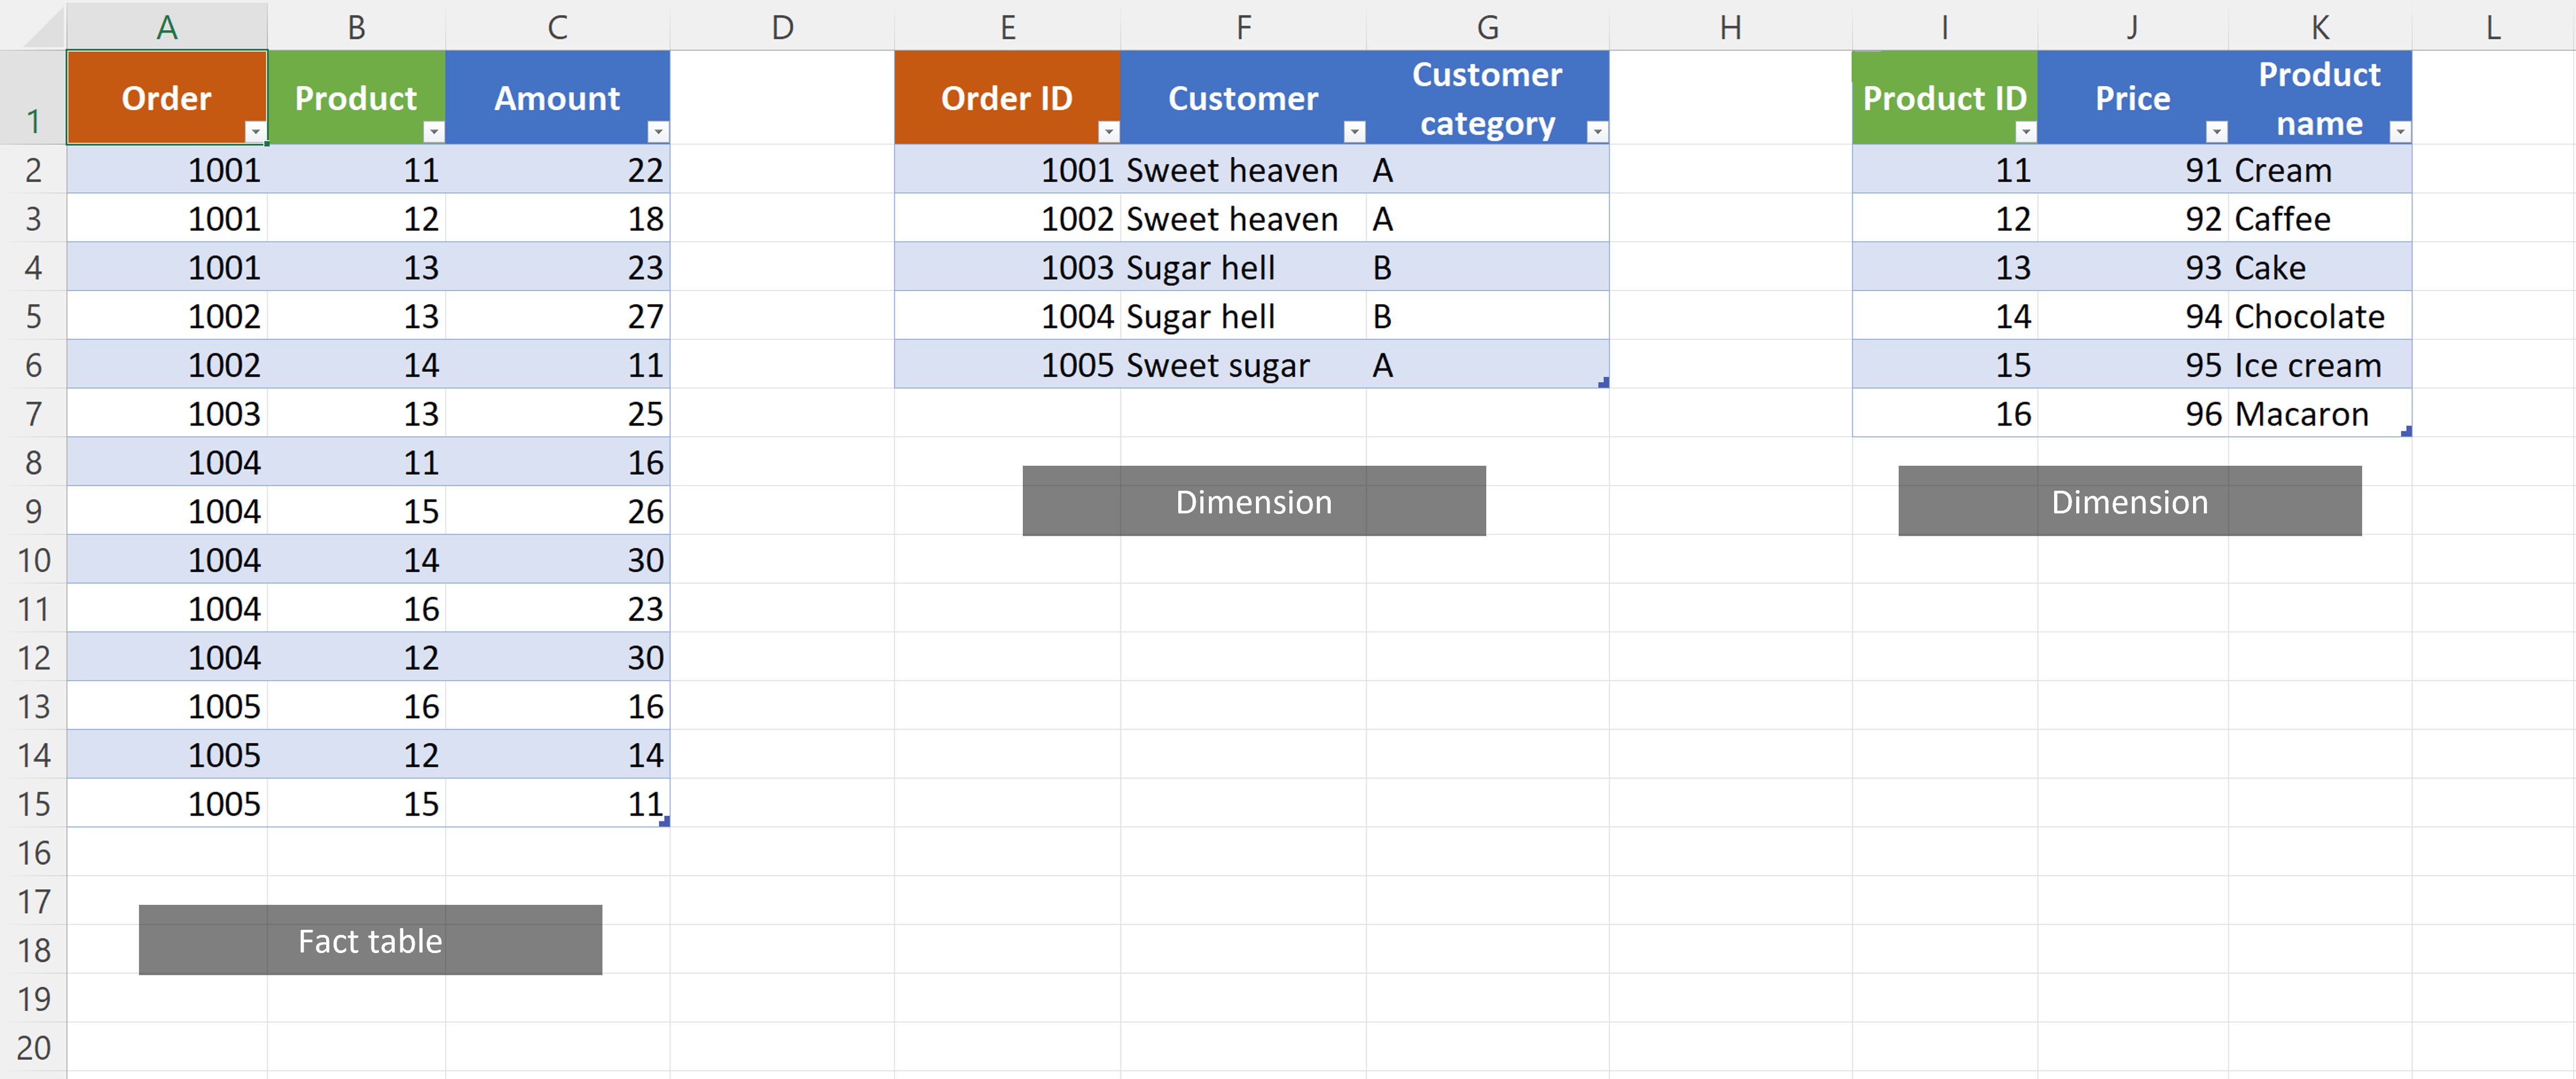
In our example, we will start from these tables – in the left there are items on orders, then there are orders and products. We can see that:
So what is the difference between fact tables and dimensions?
Fact table is a table, which typically:
Dimenzson is a table, which adds some additional info to a fact table information. For example to ID product 11 it provides the info about price (91) and name (Cream).
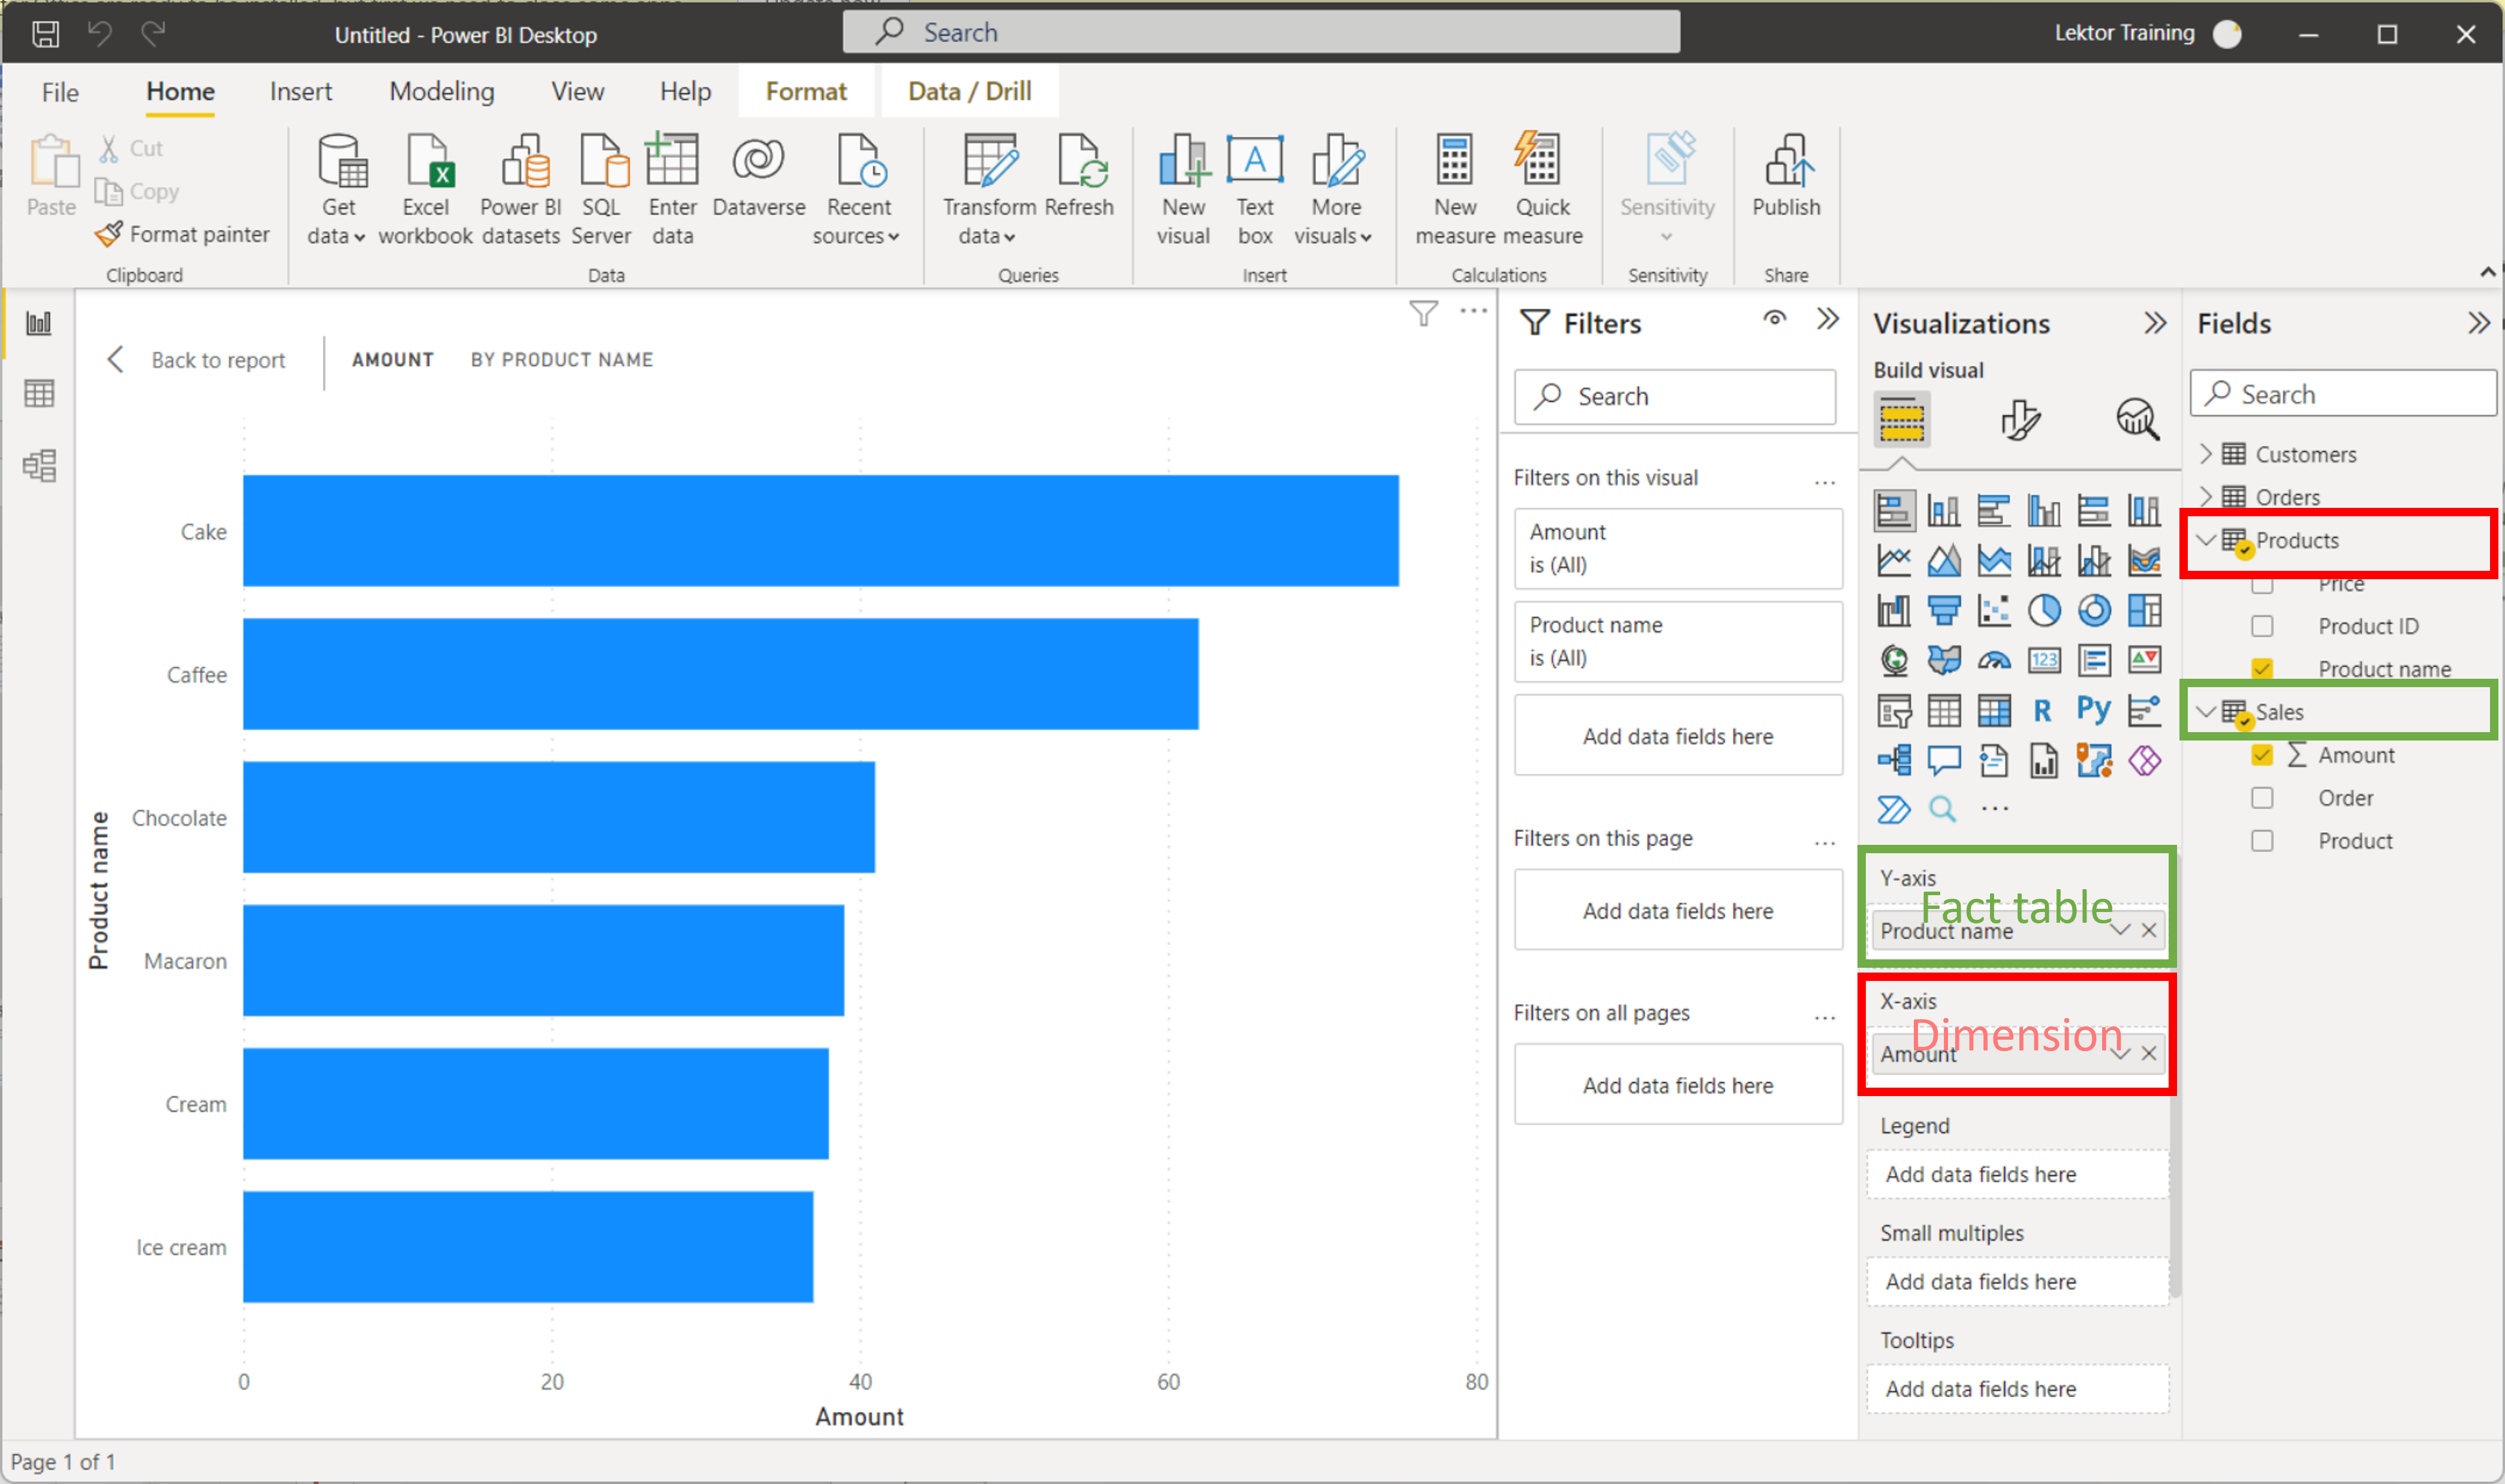
In reports generated from data models we normally use columns from both dimensions and fact tables.
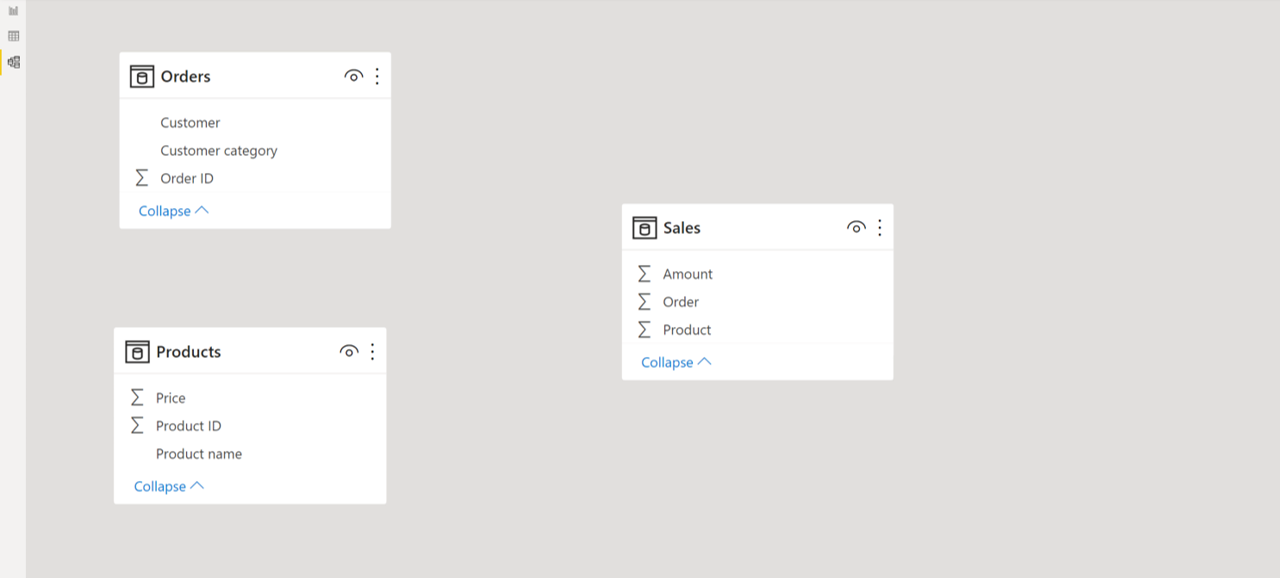
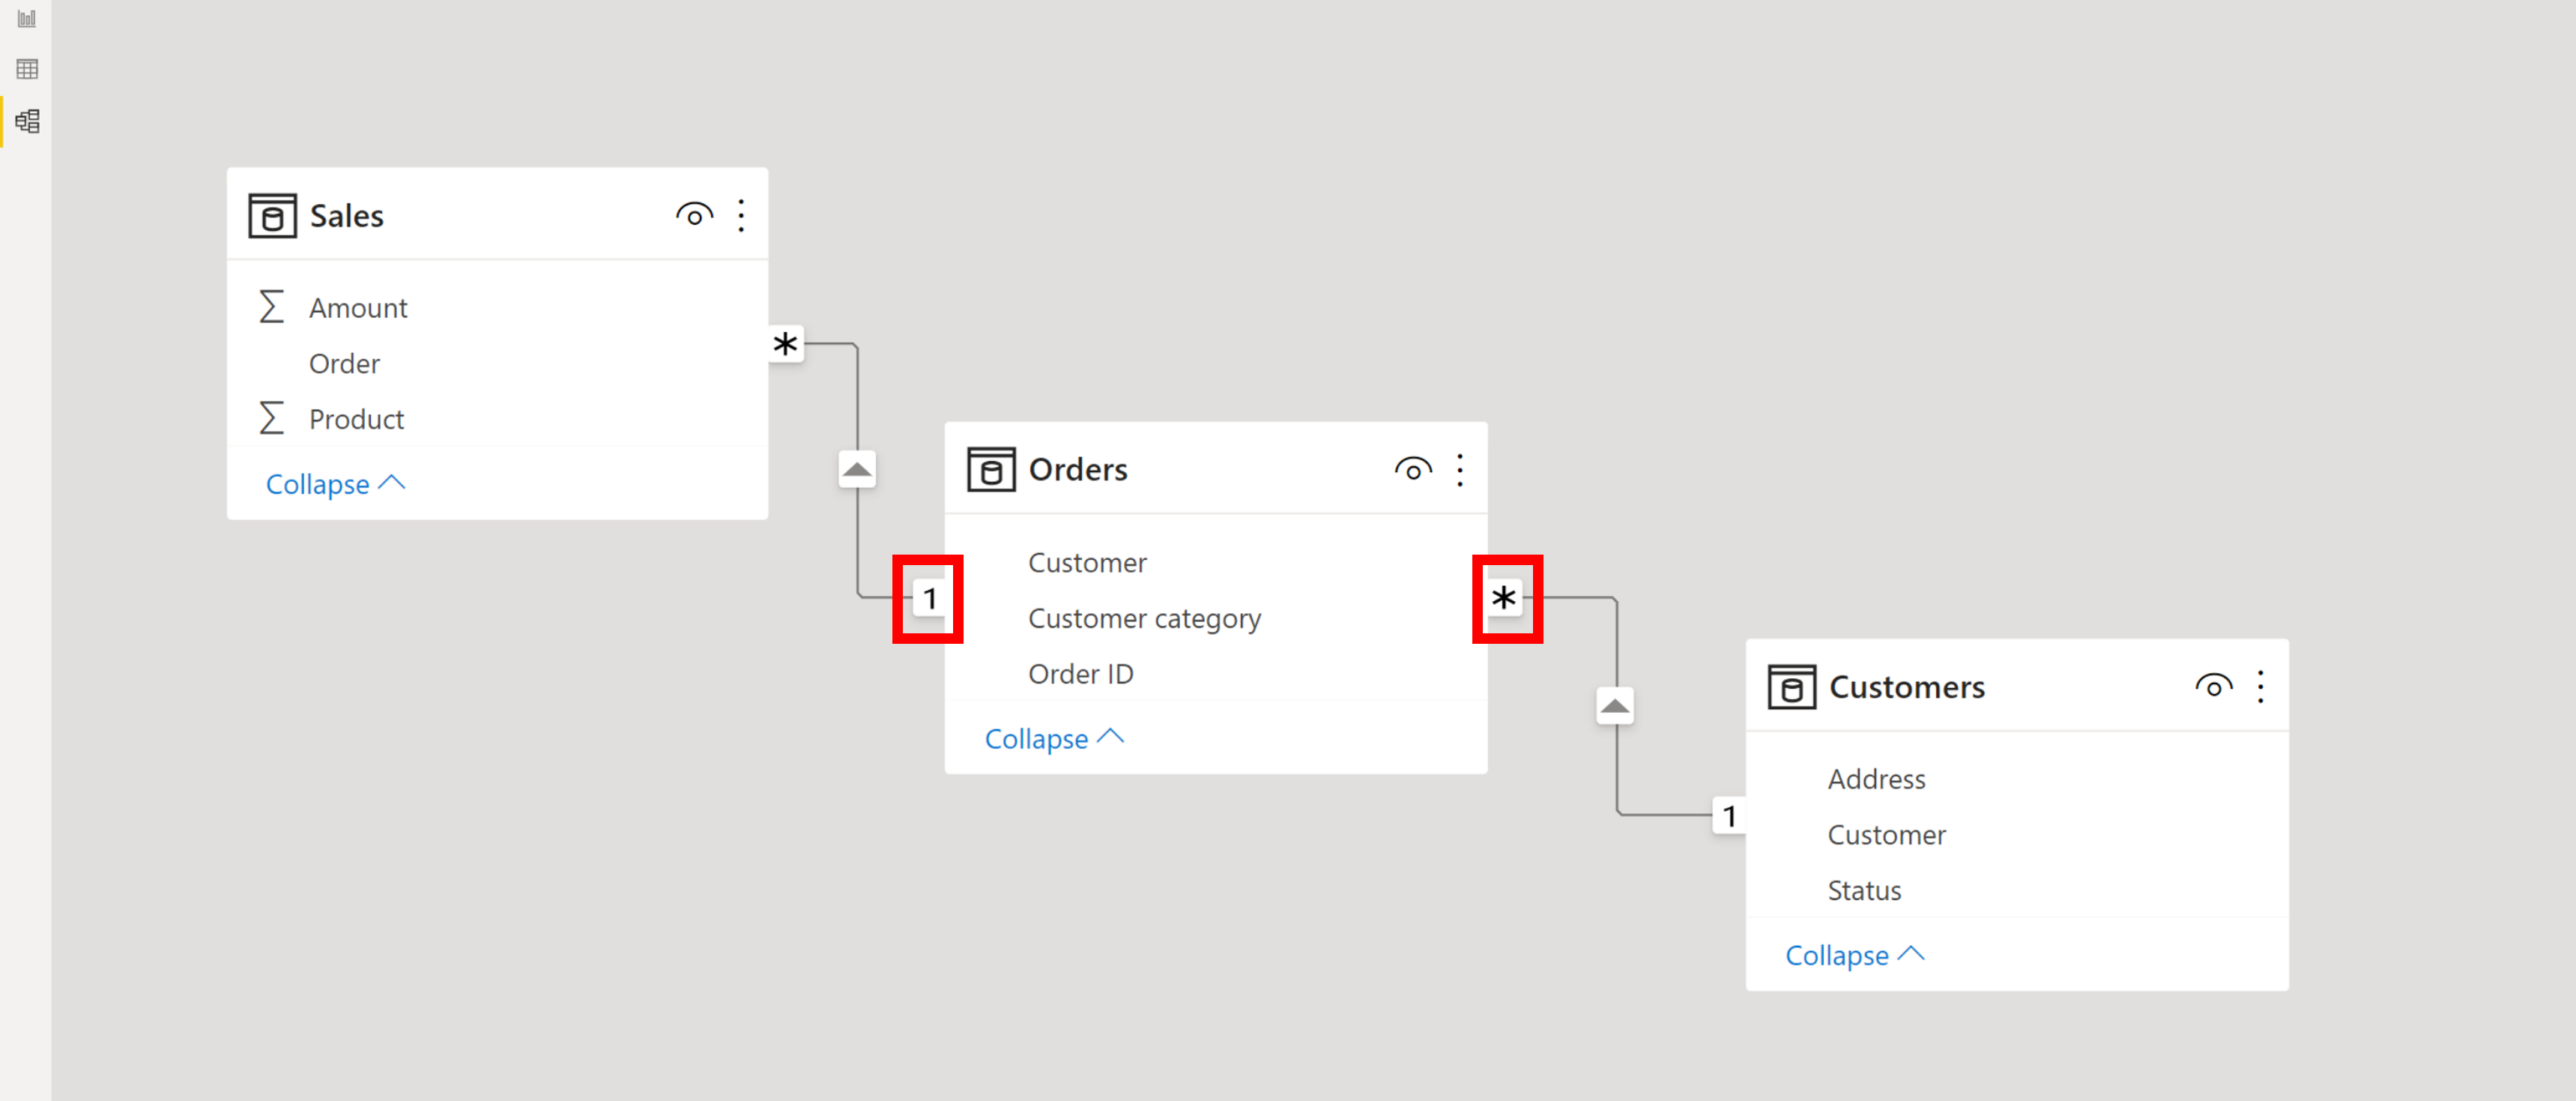
When loaded to Power BI, the tables look like this:
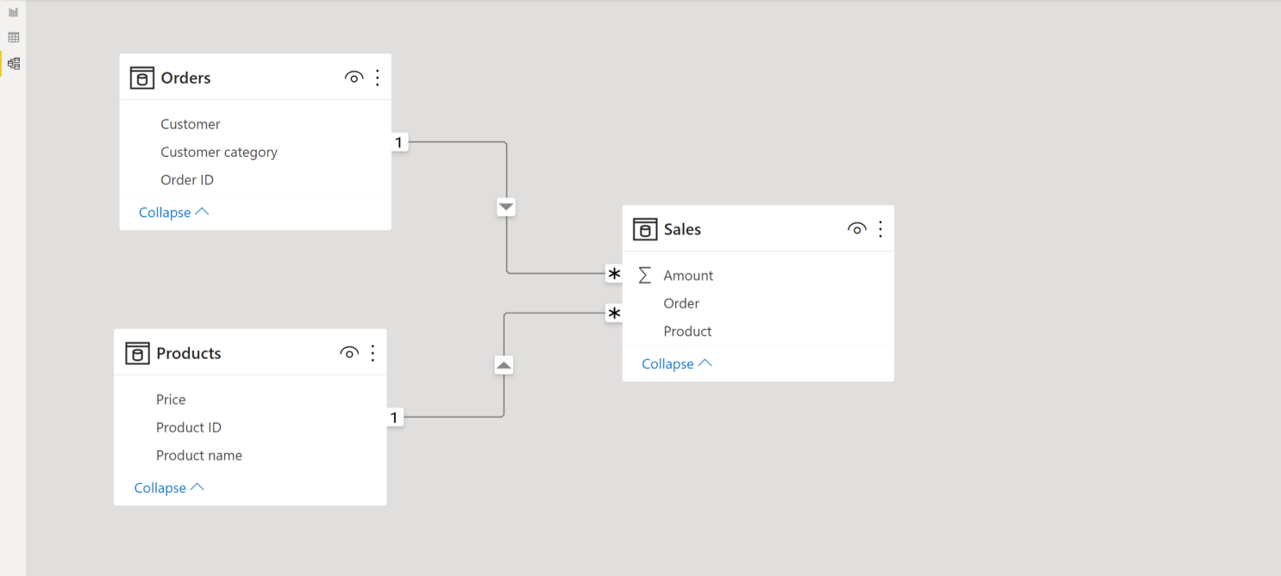
Now lets define which columns are connected. These connections are called “relationships” and can be simply done by dragging of column from one table to another.
 These columns are called “keys”. The key column must have unique values in dimension, but usually it has repeated values in a fact table.
The relationship line has “1” on one side and star on the other. The star is on the of fact table side (repeated values), number 1 is on the side of dimension (unique values).
What does it mean for report creation (or Pivot tables in Power Pivot)?
![]()
![]()
Pište kdykoliv. Odpovíme do 24h
![]()
© exceltown.com / 2006 - 2023 Vyrobilo studio bARTvisions s.r.o.