Našimi kurzy prošlo více než 10 000+ účastníků
2 392 ověřených referencí účastníků našich kurzů. Přesvědčte se sami
This article is about working with scenarios in Excel.
Scenarios can be used for planning, when there are multiple different forecasts of future development, and we want to observe their impact on some result.
In this example, there is a company planning their profit for next year. It is based on two variants of revenue, so as we want to see how changing of estimated revenue changes the estimated profit, which equals revenue – fixed costs – variable costs (30% of revenue).
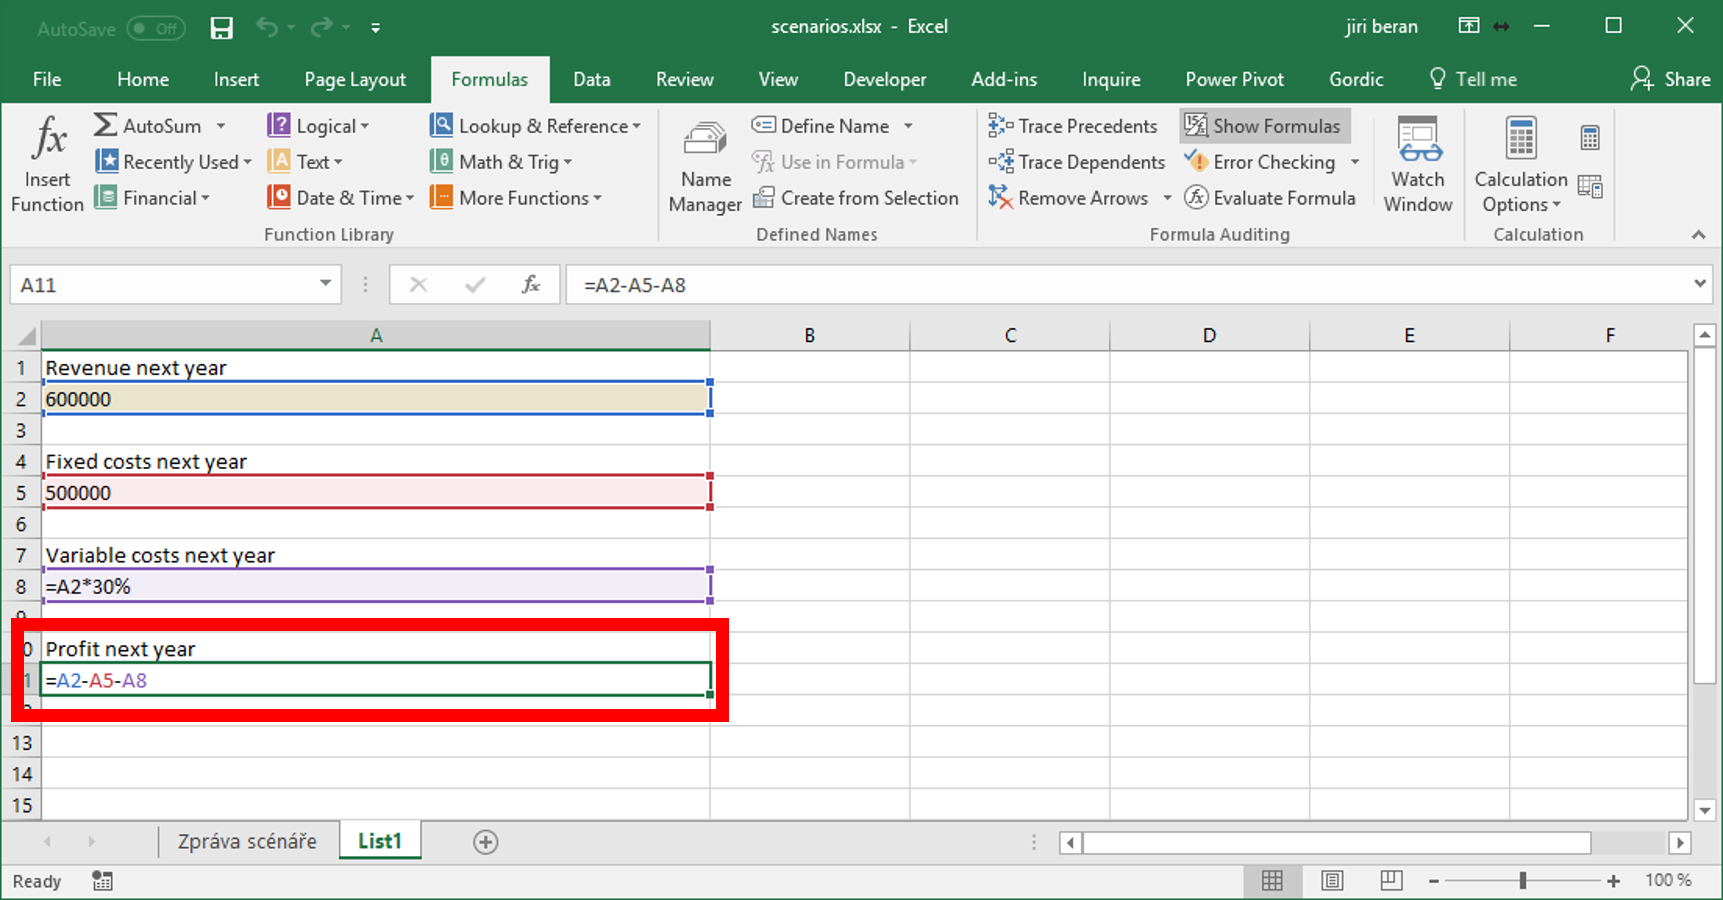
For revenue, we work with two possible options. With optimistic (1 000 000) and pessimistic (600 000). (Of course, you can have more options then two…)
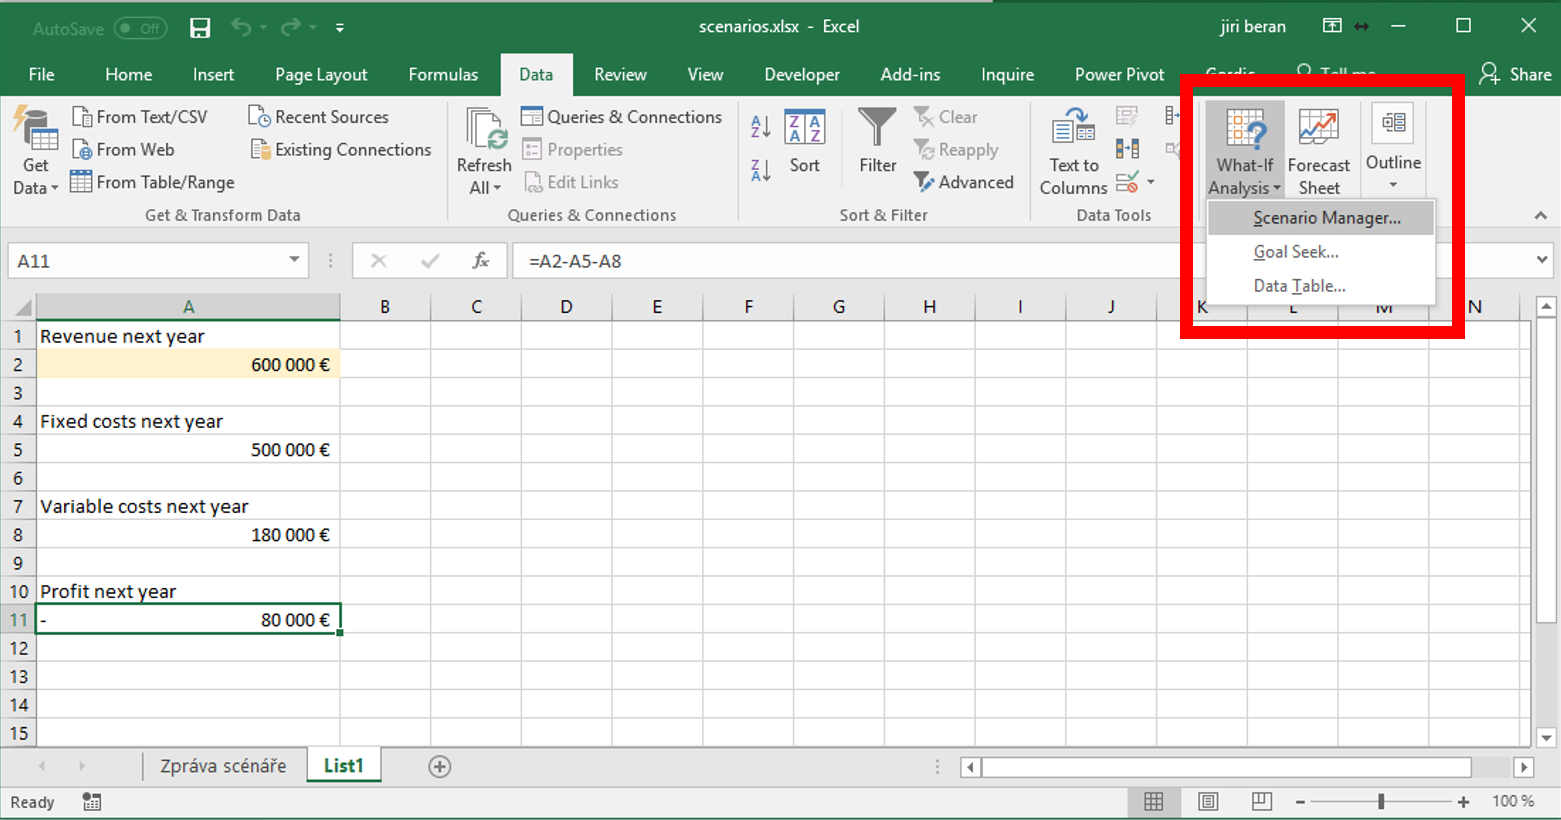
Create scenario on Data / What-If Analysis / Scenario manager.
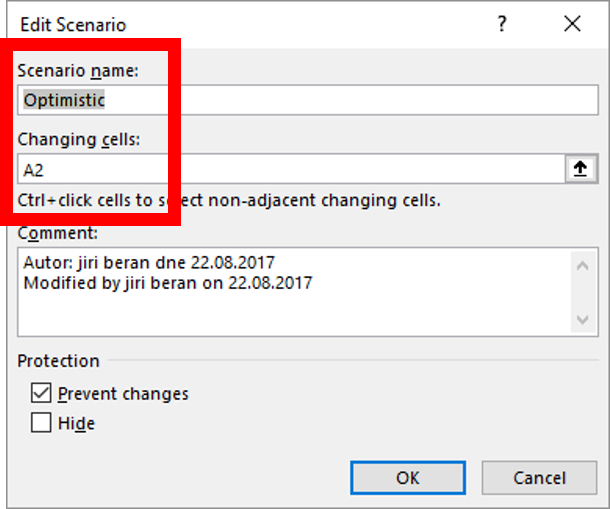
In first step define the name and the cell, that will be different for different scenarios. Now it is A2, but you can use more cells then 1.
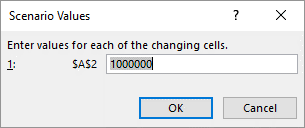
In next step define, which value will be in this cell for this scenario. In this case it may be the 1 000 000.
The other scenarios could be added the same way. What can we do with them?
We can doubleclick on them and thus switch between options.
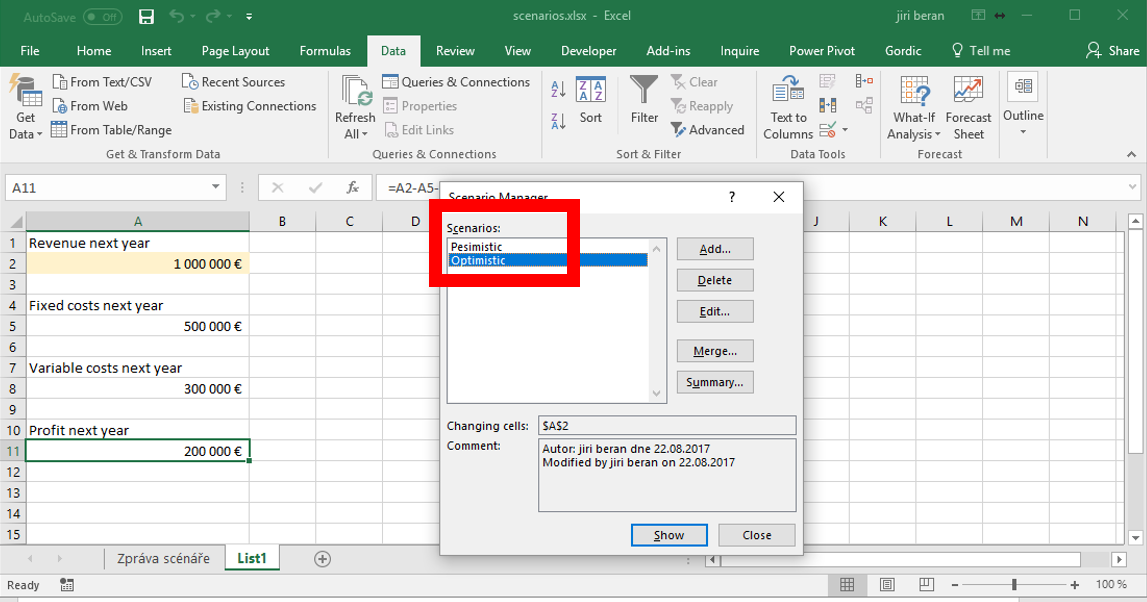
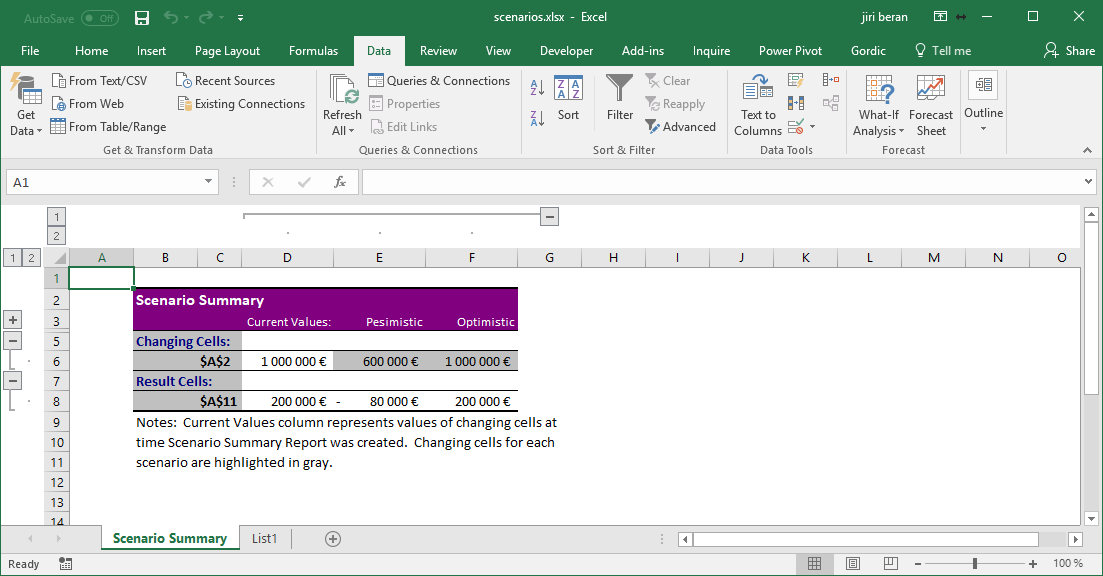
So we can show the summary, showing for all scenarios together, the impact of revenue changes to profit.
The sample file can be downloaded downloaded from here.
Two comments at the end:
This sample scenario is extremely simple ahd the results can be seen even without scenarios, but the business scenarios can be much more complex.
However, scenarios can be often effectively replaced by TABLE function or even normal formulas…
![]()
![]()
Pište kdykoliv. Odpovíme do 24h
![]()
© exceltown.com / 2006 - 2023 Vyrobilo studio bARTvisions s.r.o.