Našimi kurzy prošlo více než 10 000+ účastníků
2 392 ověřených referencí účastníků našich kurzů. Přesvědčte se sami
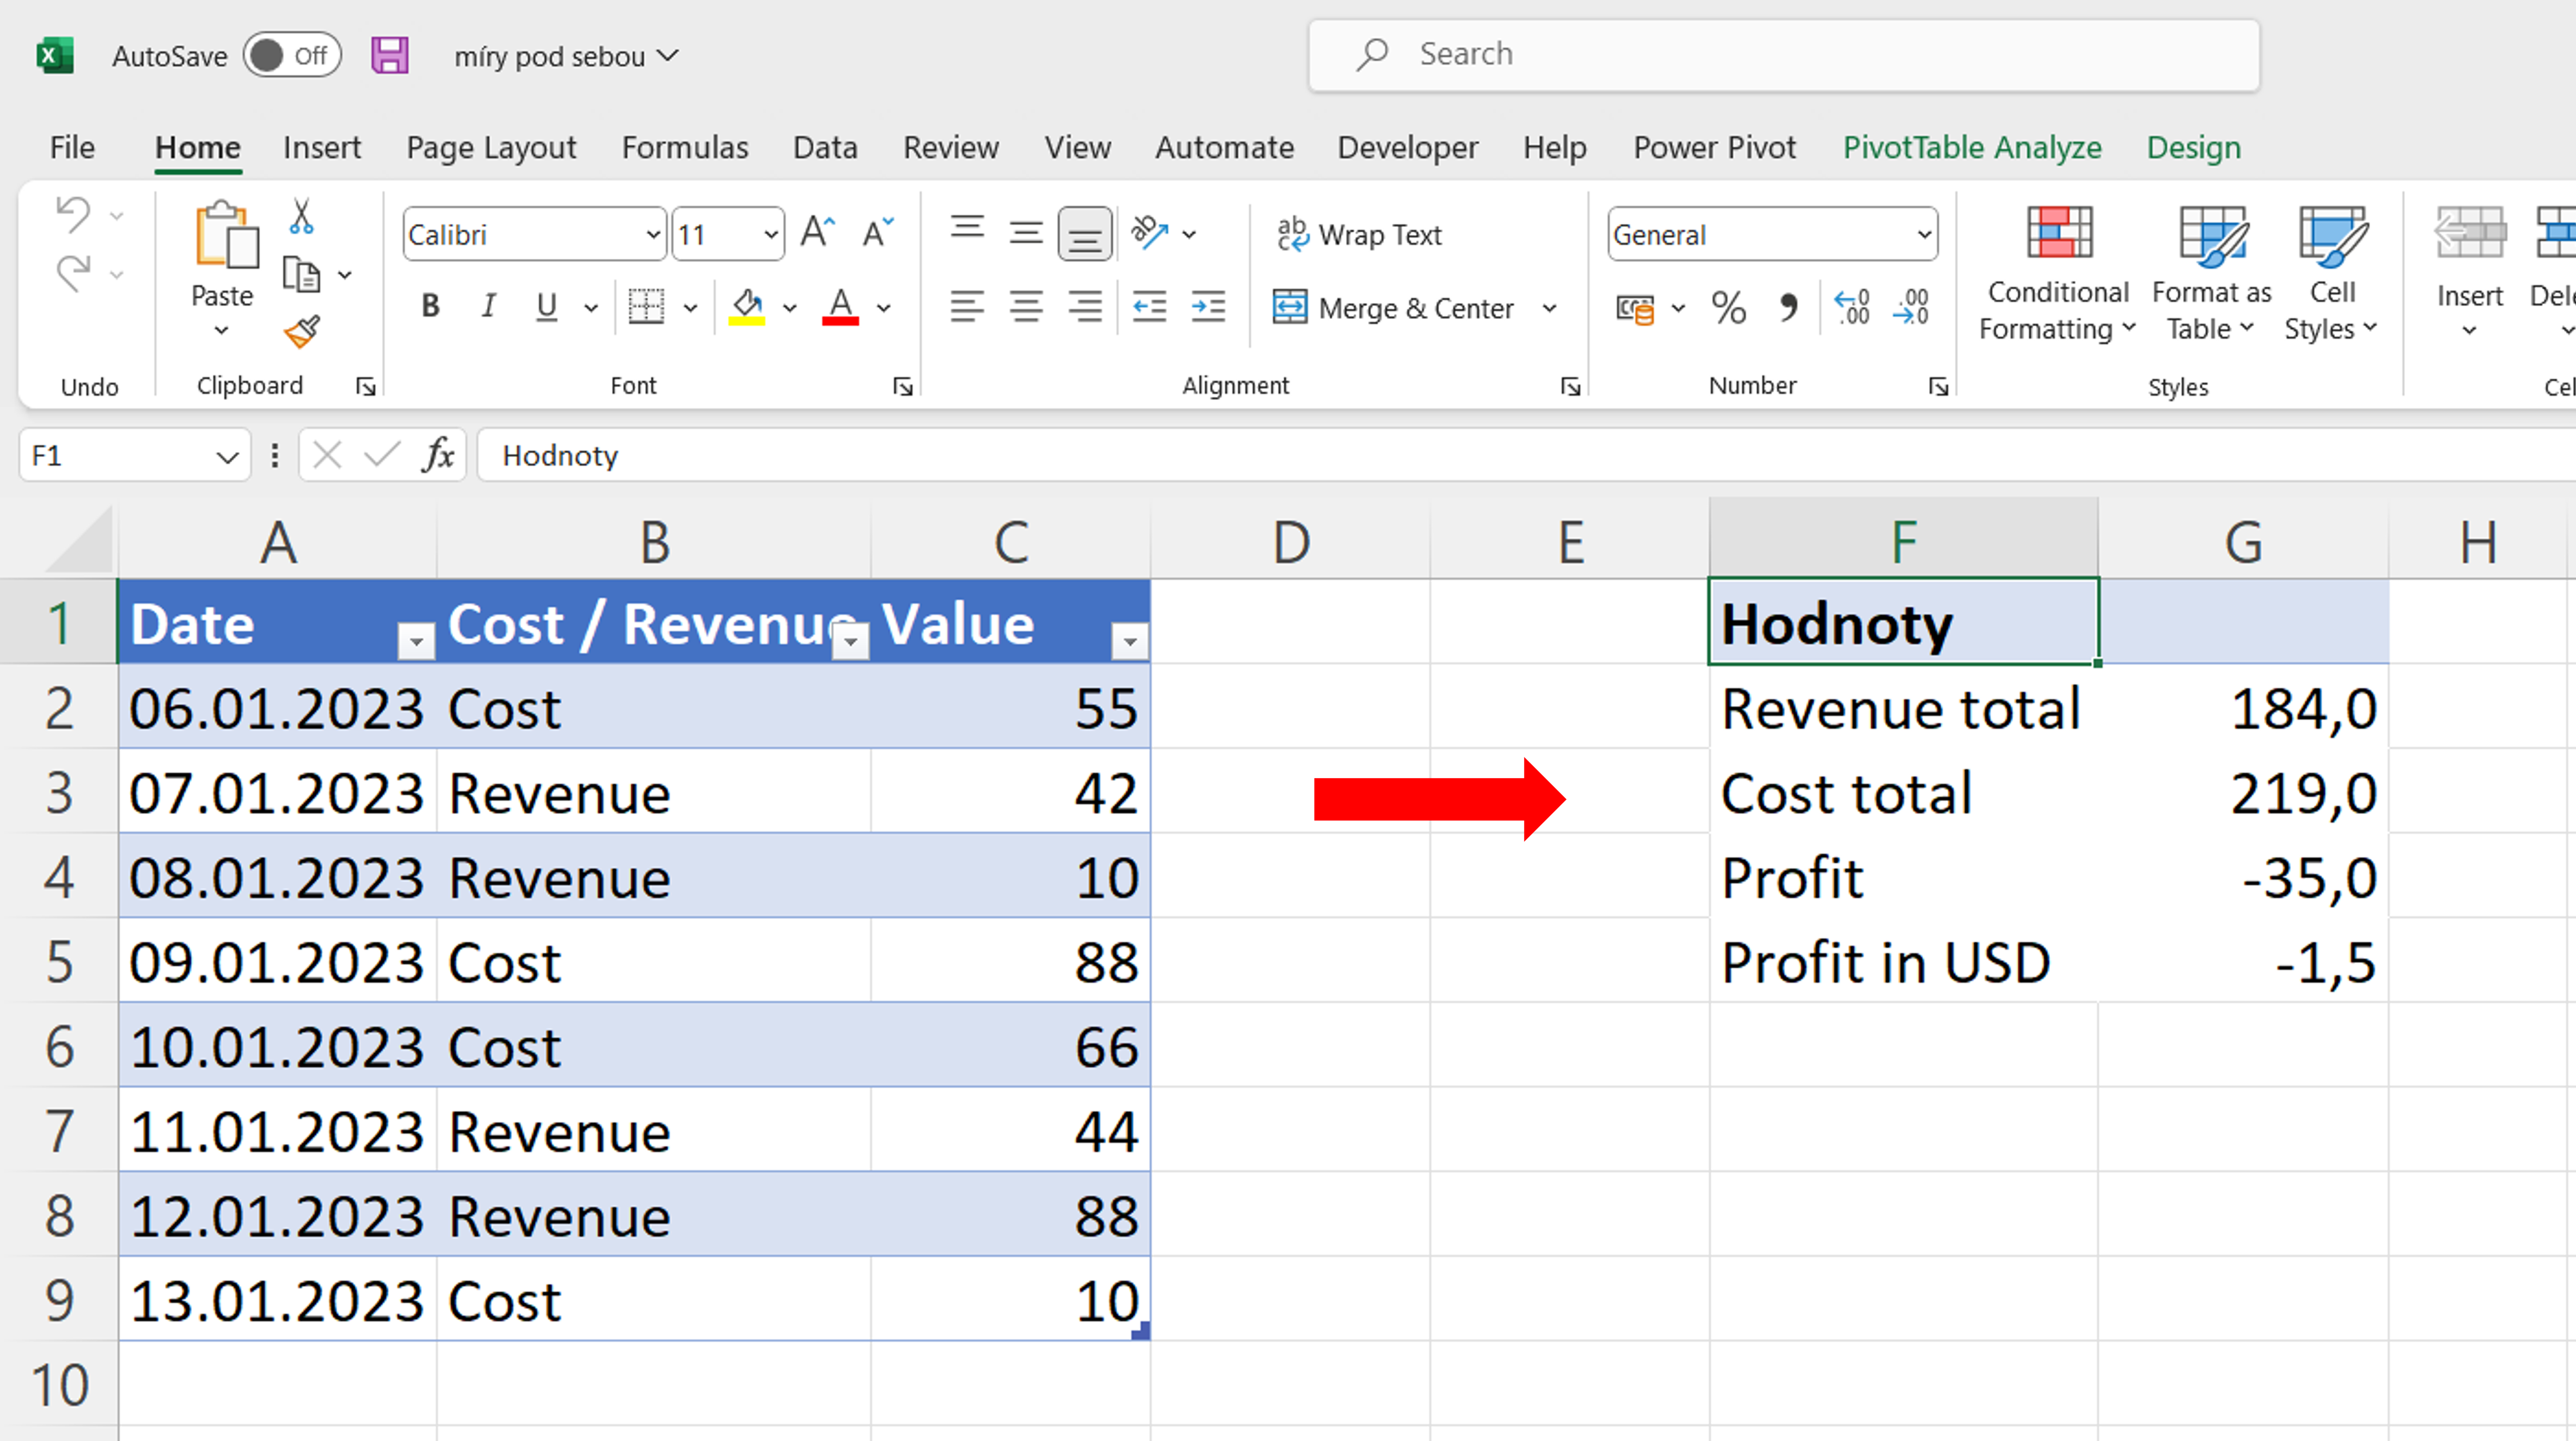
You have a source table, you want to calculate various data from it using a pivot table and put these data below each other in rows (not in columns, where they are normally placed).
Typically, this view is used to create financial statements:
Yes, you could use calculated items – but they have a big drawback in that they can’t be used on top of a Power Pivot data model, so they can’t use the DAX language.
E.g. from the table on the left, we want to calculate the costs to the contingency table on the right, add the revenues, then subtract them from each other as profit, and then recalculate the profit using the exchange rate to USD, and calculate this and that…
So how to do it?
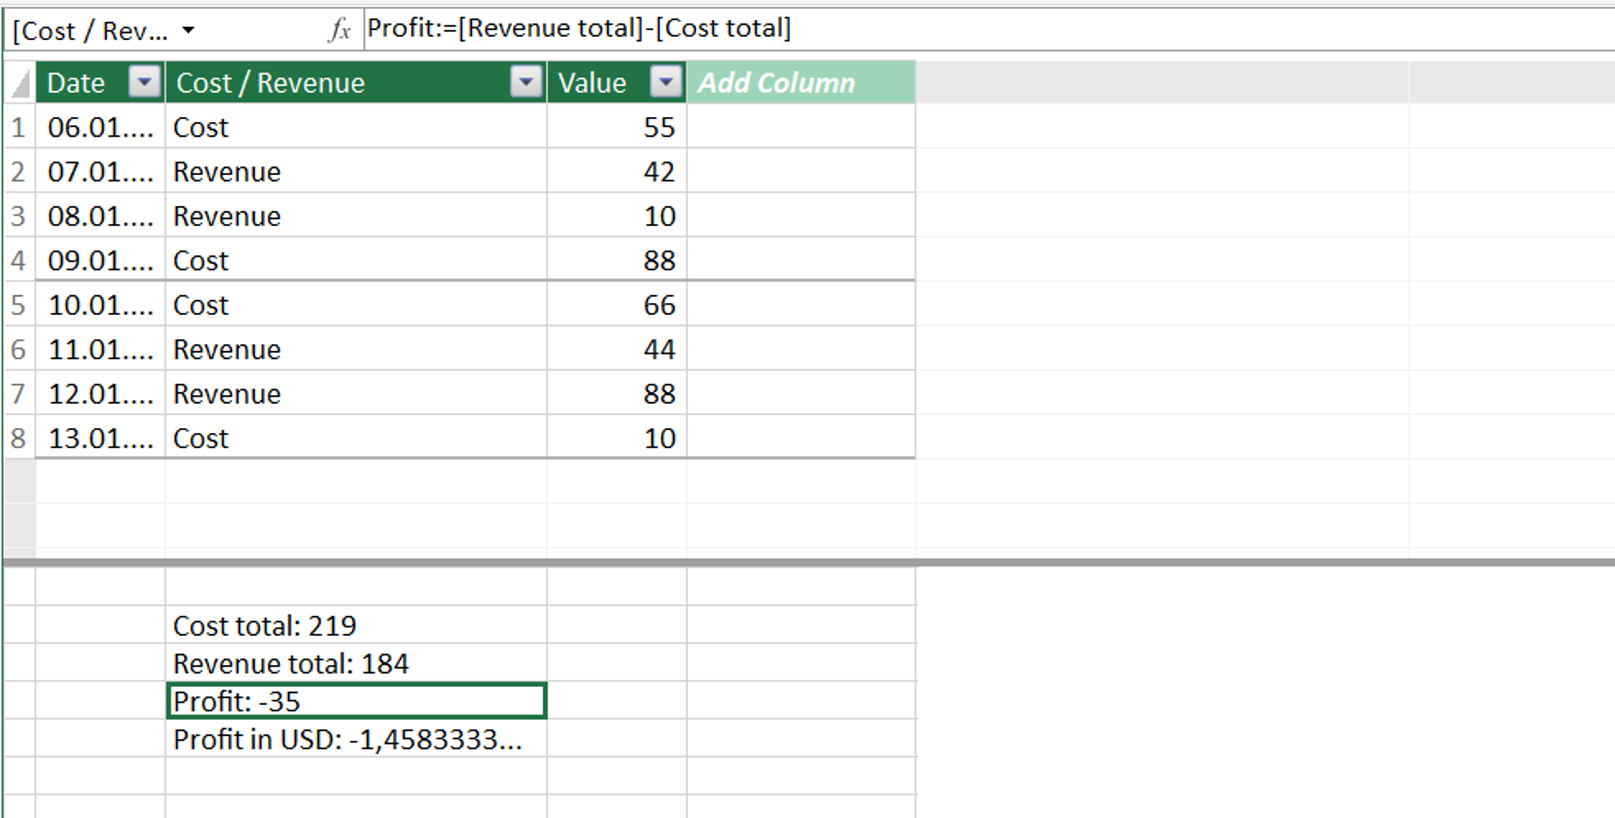
First, let’s prepare the measures. They can be explicit measures (calculated with DAX) or implicit (ordinary numerical columns, generally you don’t need to prepare them at all).
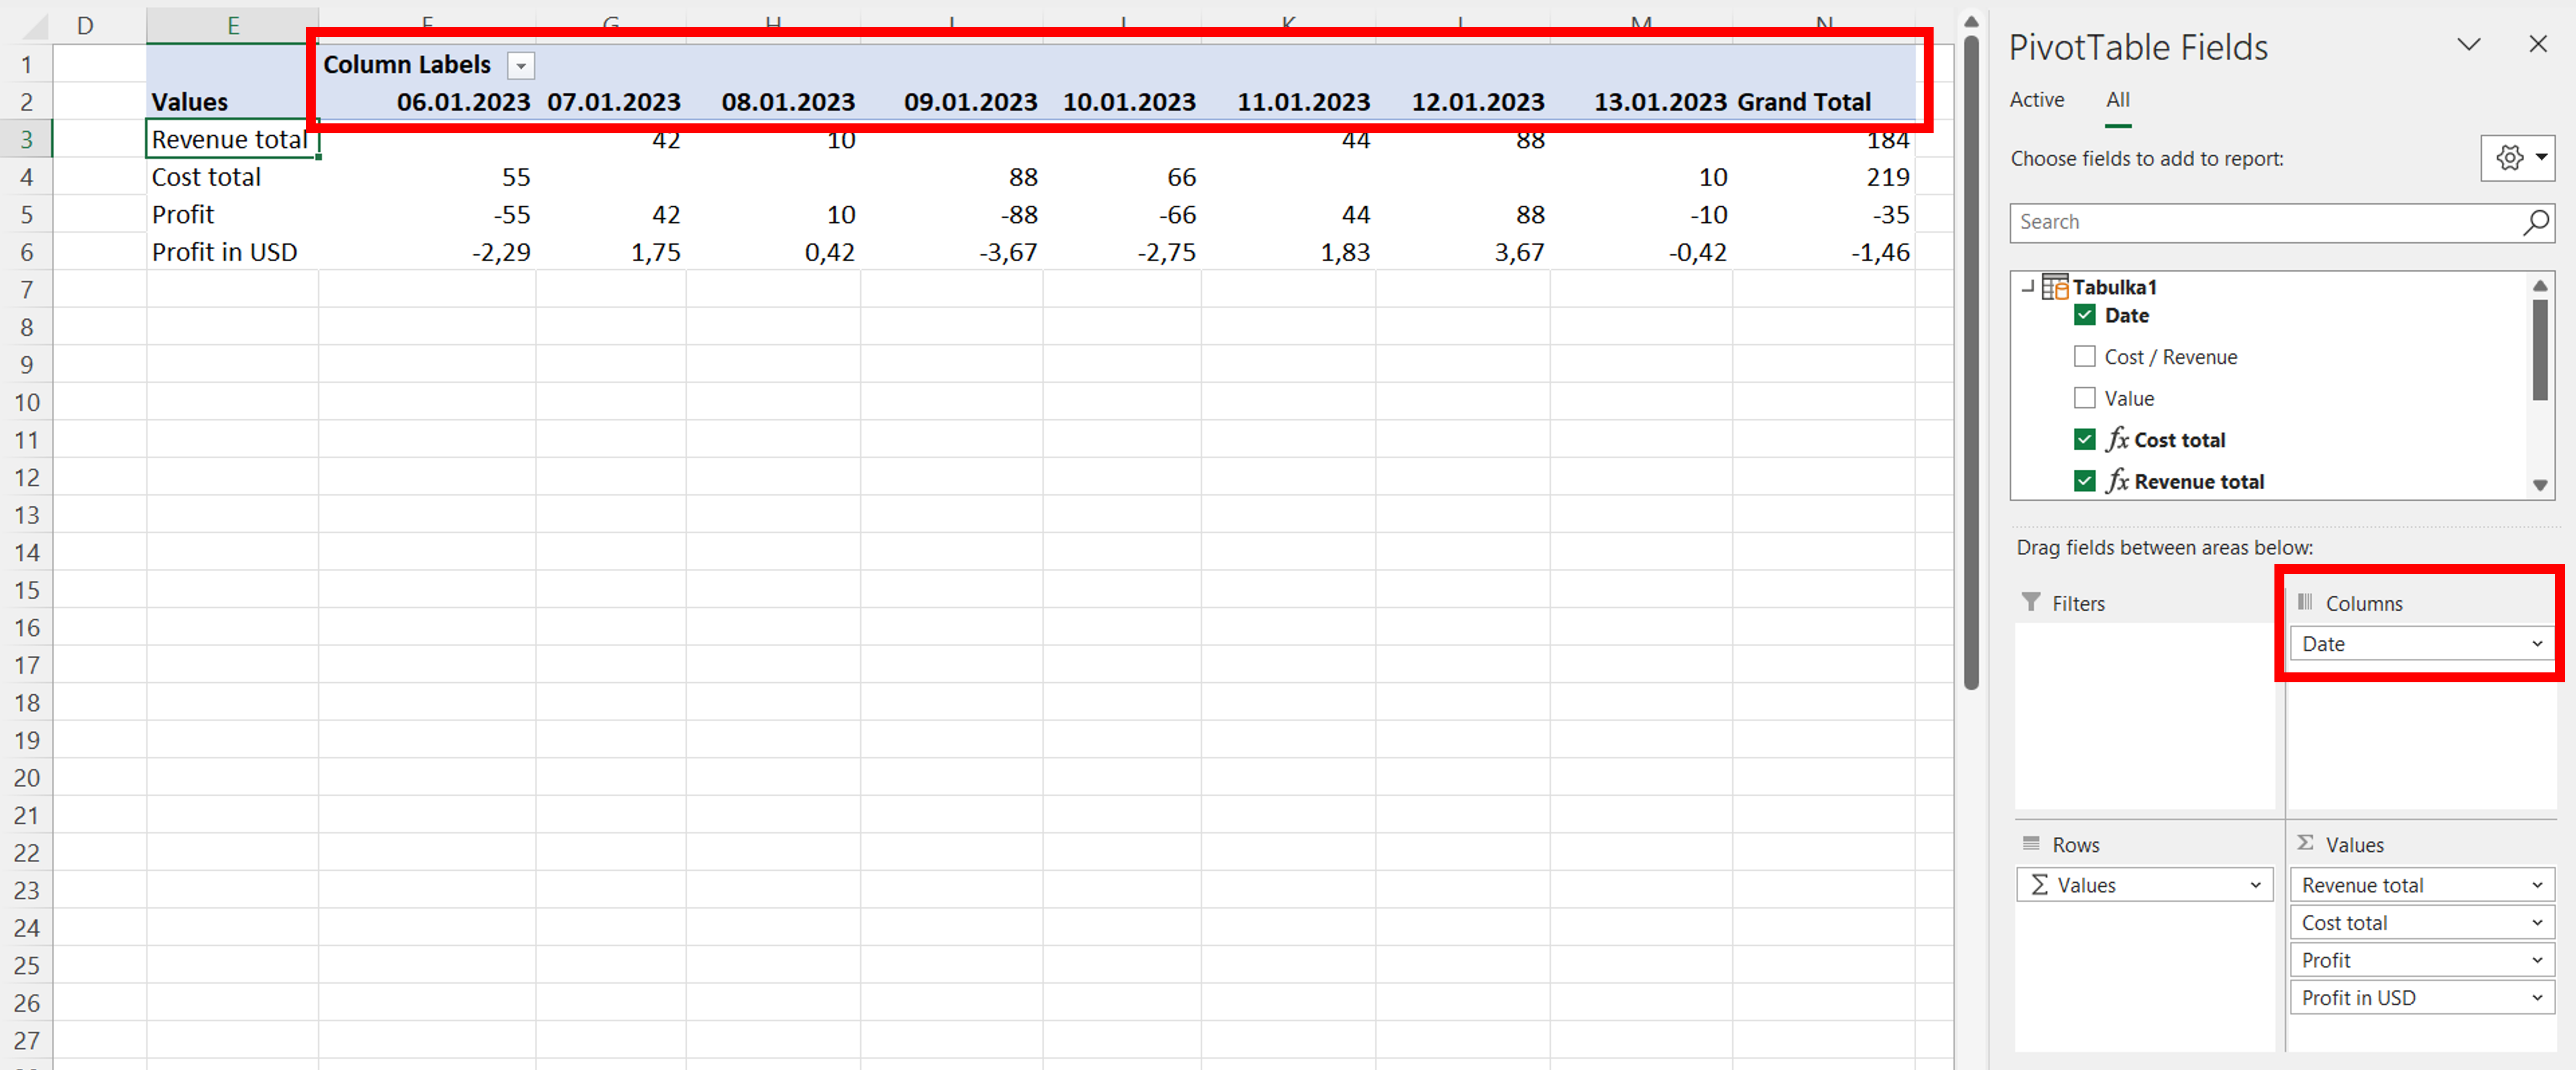
Then we create a pivot table. We put measures (at least two) into values.
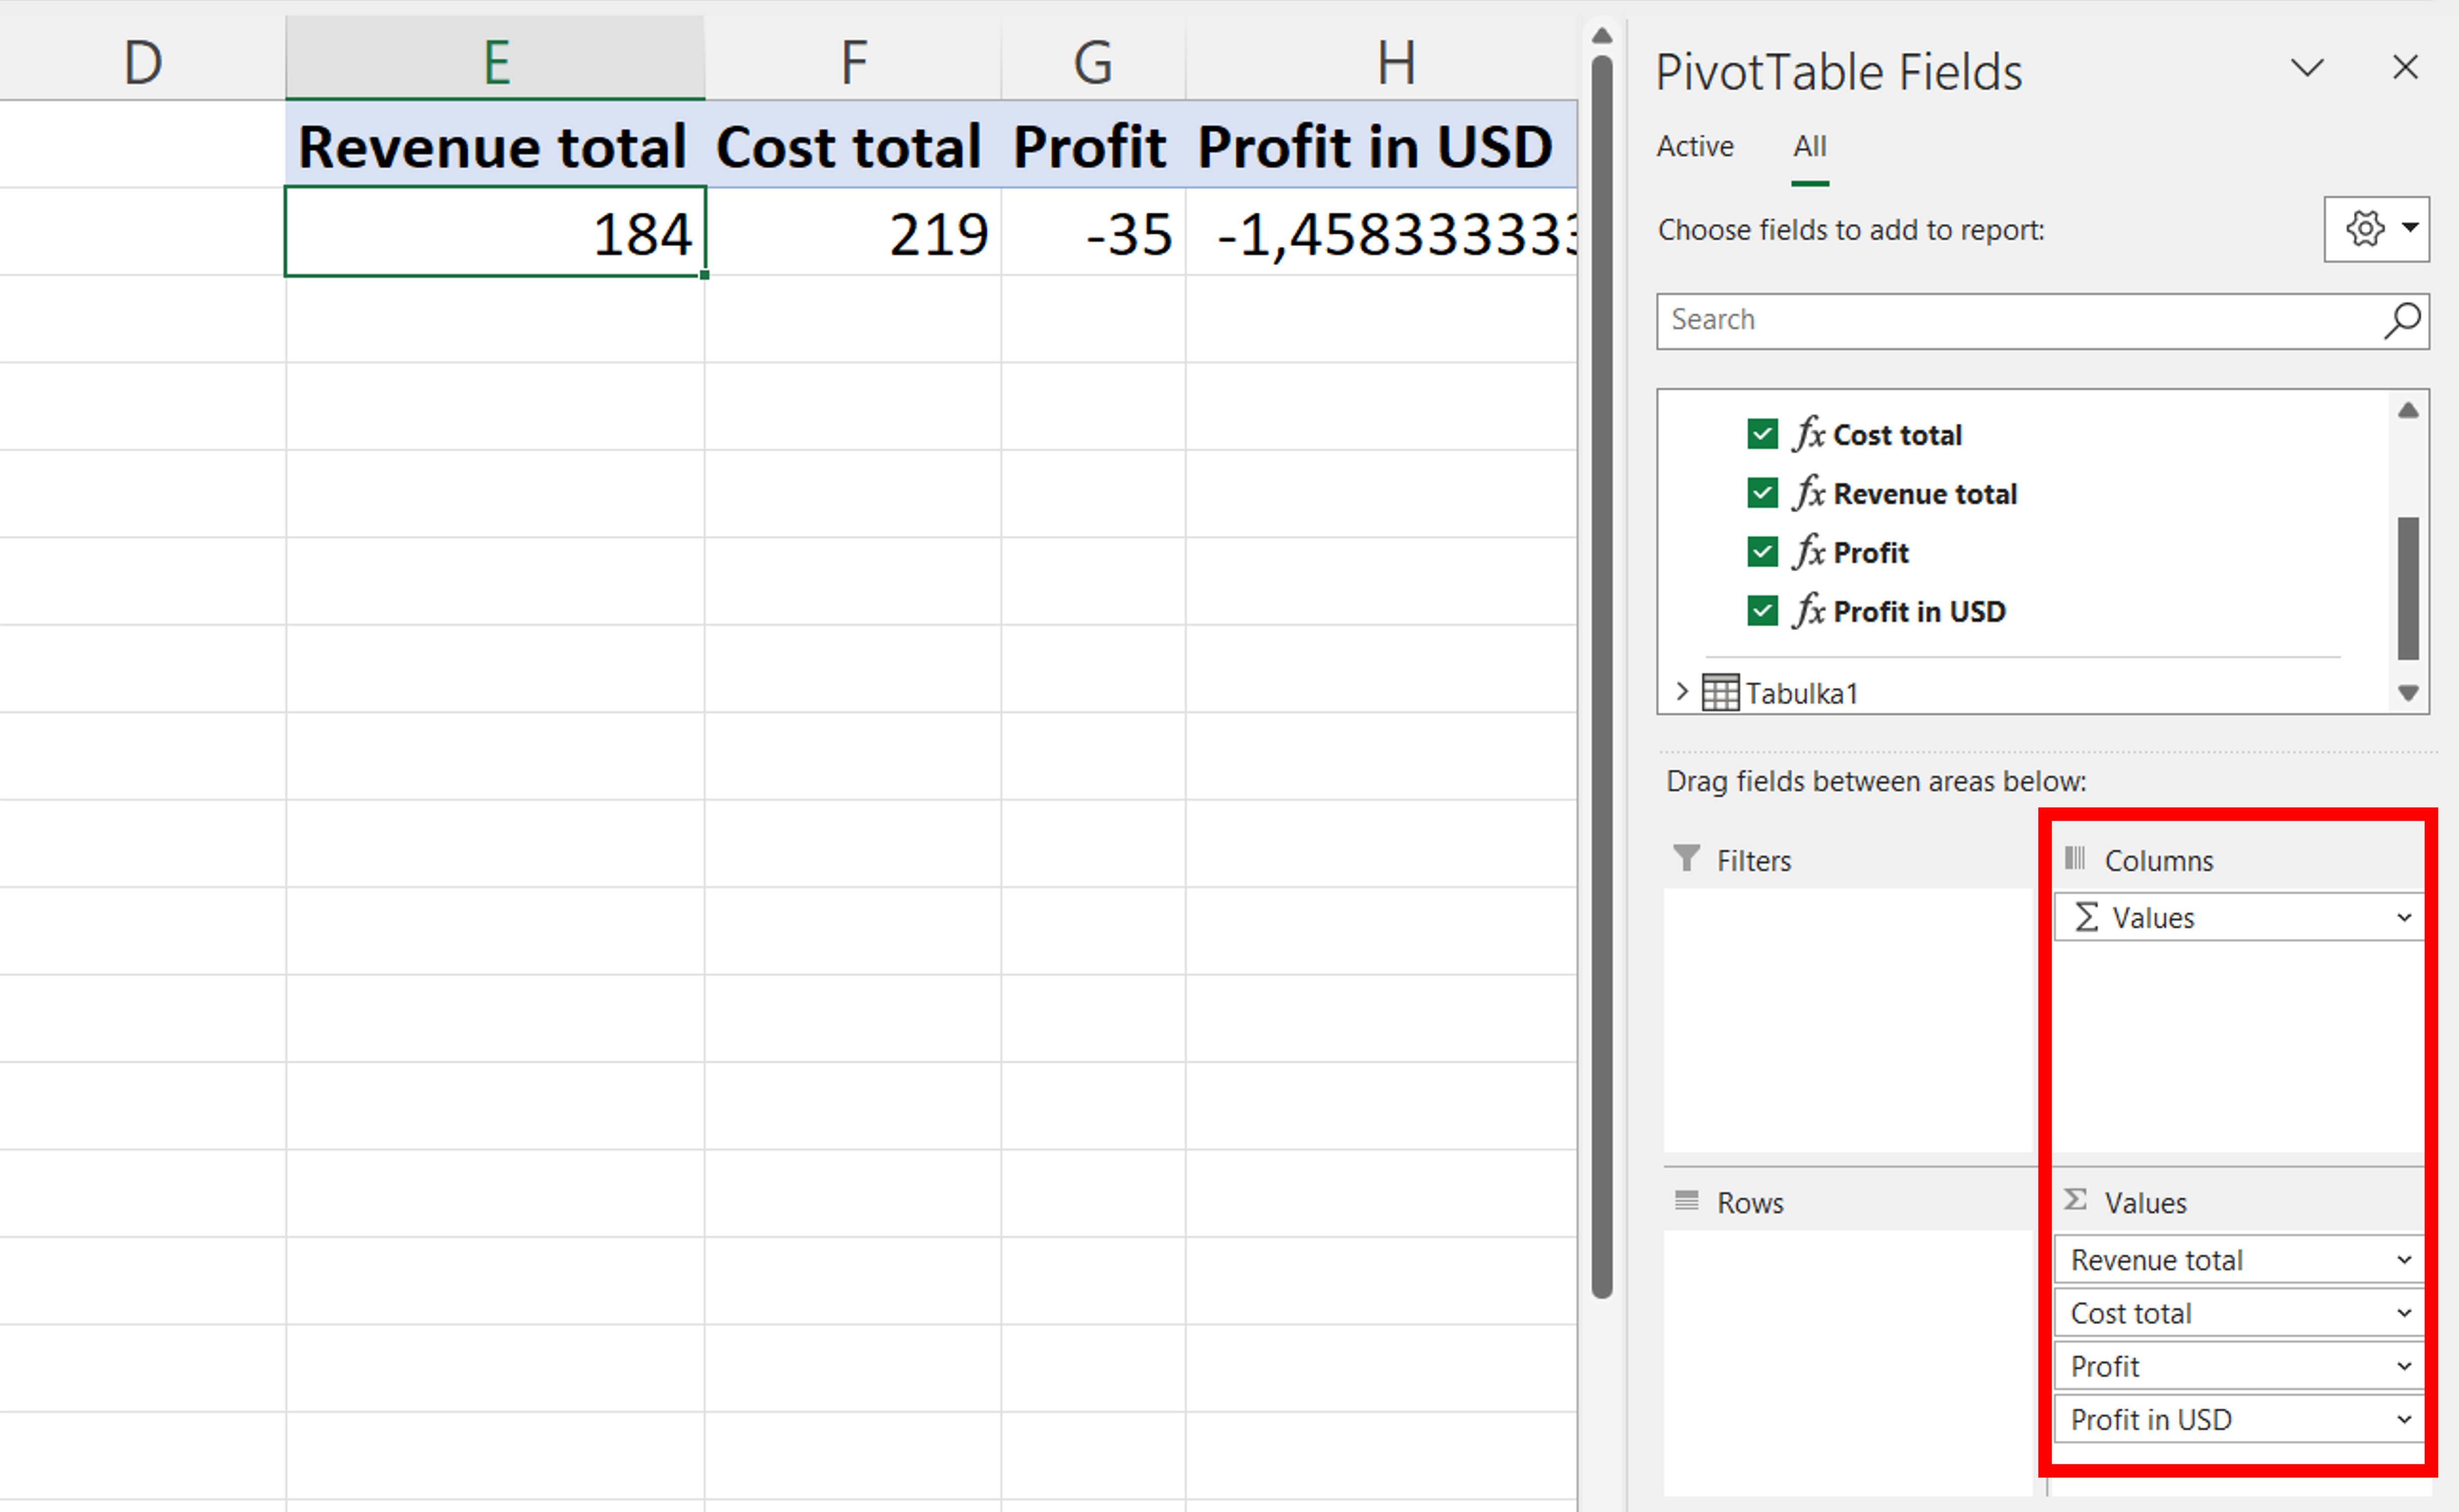
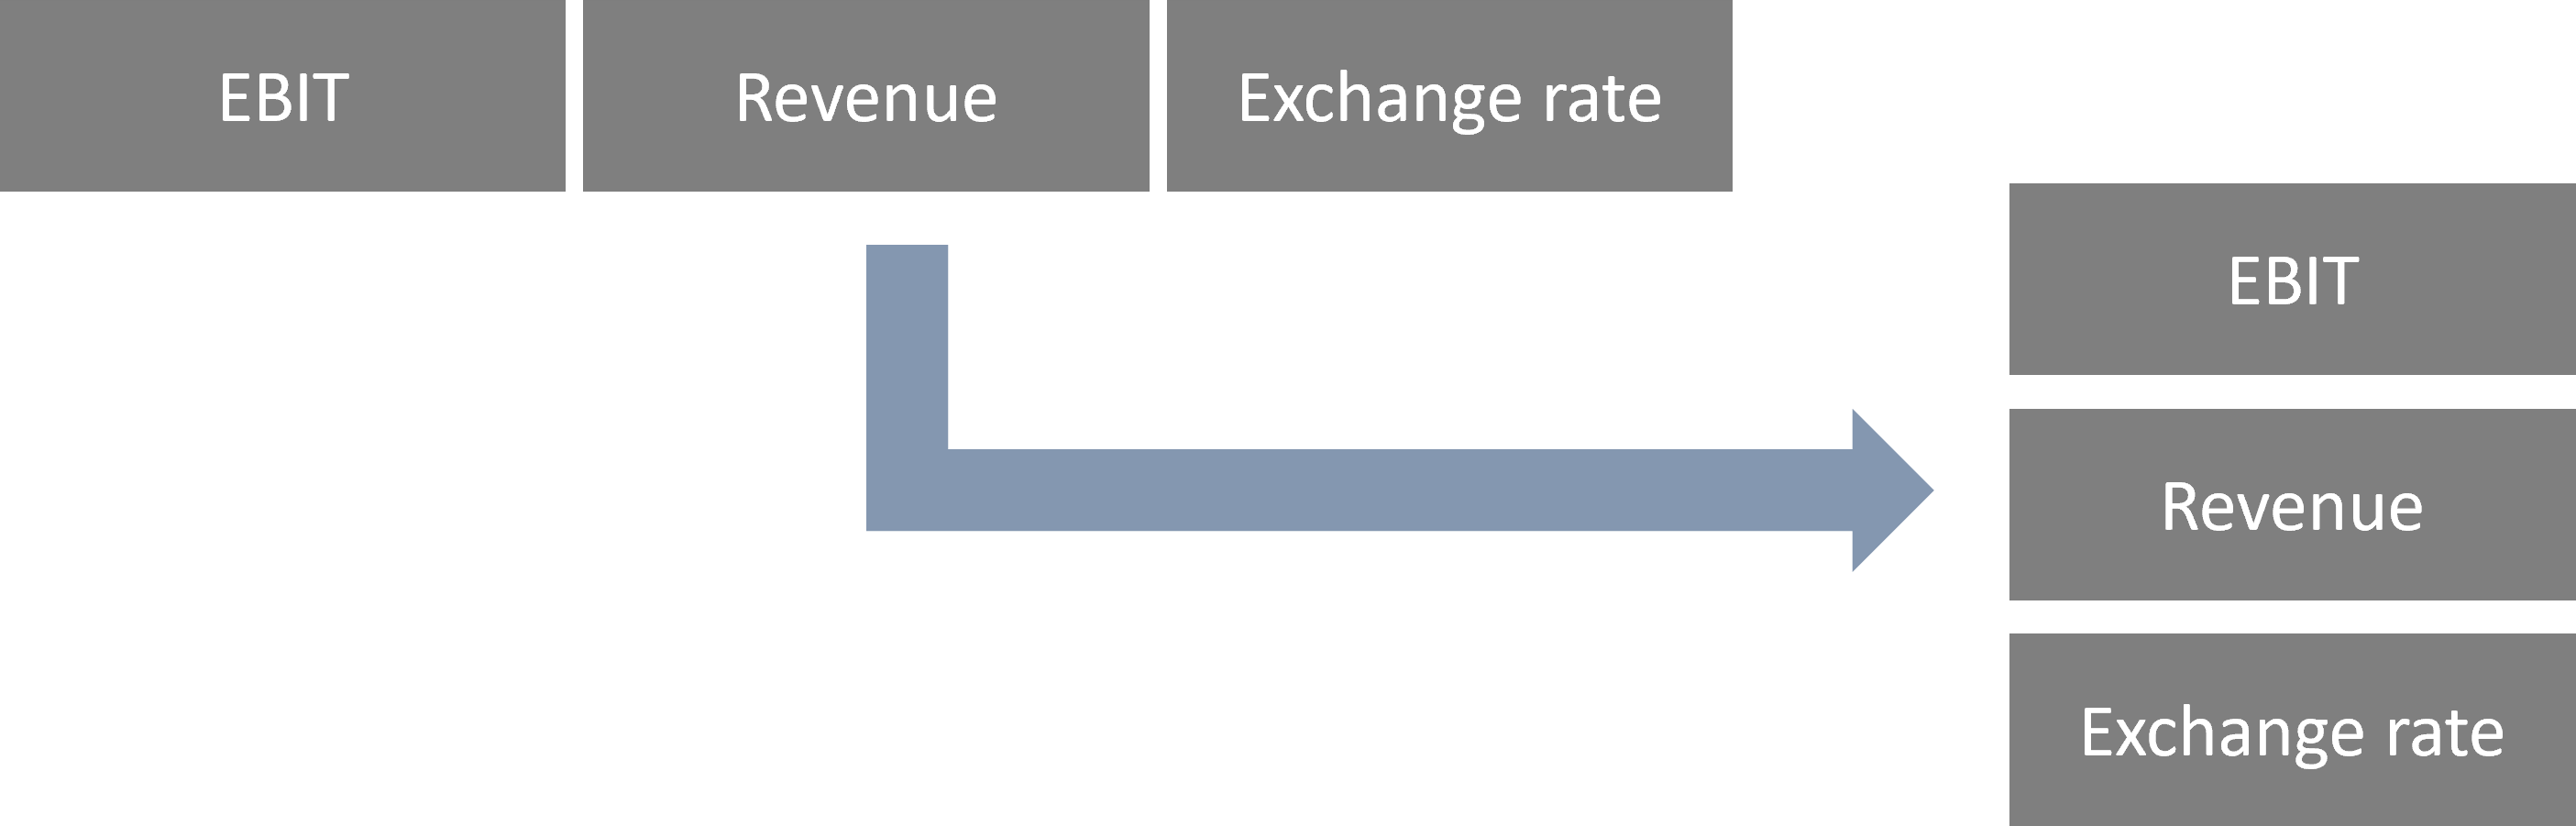
This will show the important Values field in the columns.
We move it from columns to rows and that’s it. The rates are below each other.

Of course, we can further group them in any way with other row or column fields:
![]()
![]()
Pište kdykoliv. Odpovíme do 24h
![]()
© exceltown.com / 2006 - 2023 Vyrobilo studio bARTvisions s.r.o.