Našimi kurzy prošlo více než 10 000+ účastníků
2 392 ověřených referencí účastníků našich kurzů. Přesvědčte se sami
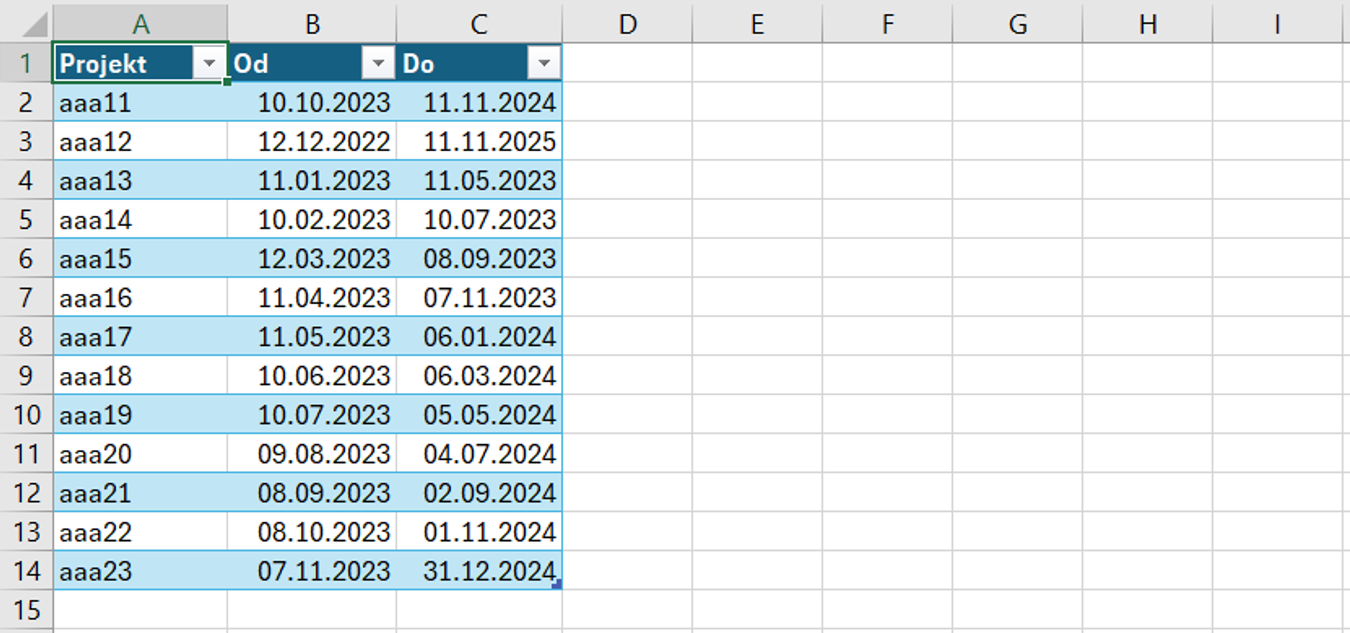
In each row there is the period, its beginning and end, both as a date datatype. And you need statistics by month.
E.g. you have a list of contracts with information about the beginning and the end of validity, and you need to find out for each month how many of them were valid in that month.
The easiest way is (usually) to split each row into multiple rows, one for each month covered by this row.
But how to do it?
If we start from this table:
We can use this syntax:
Why this?
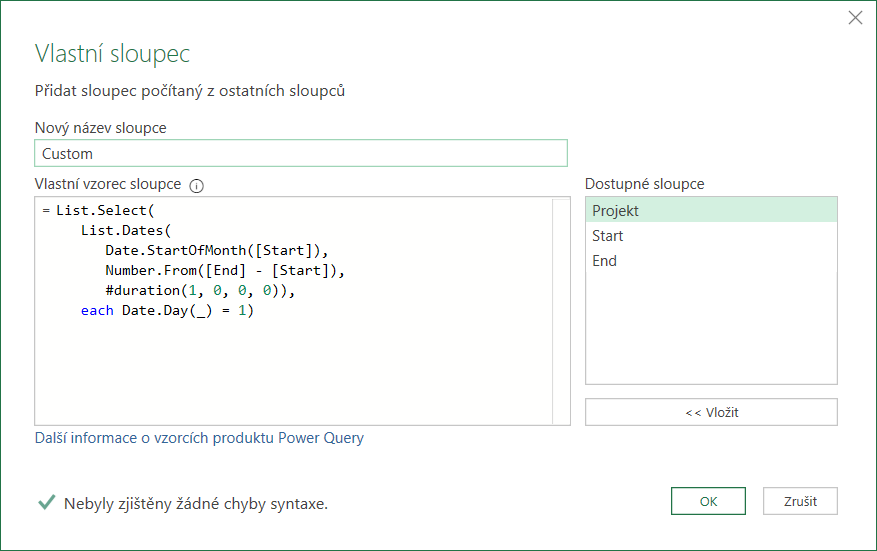
This generates lists, that can be transformed to rows.
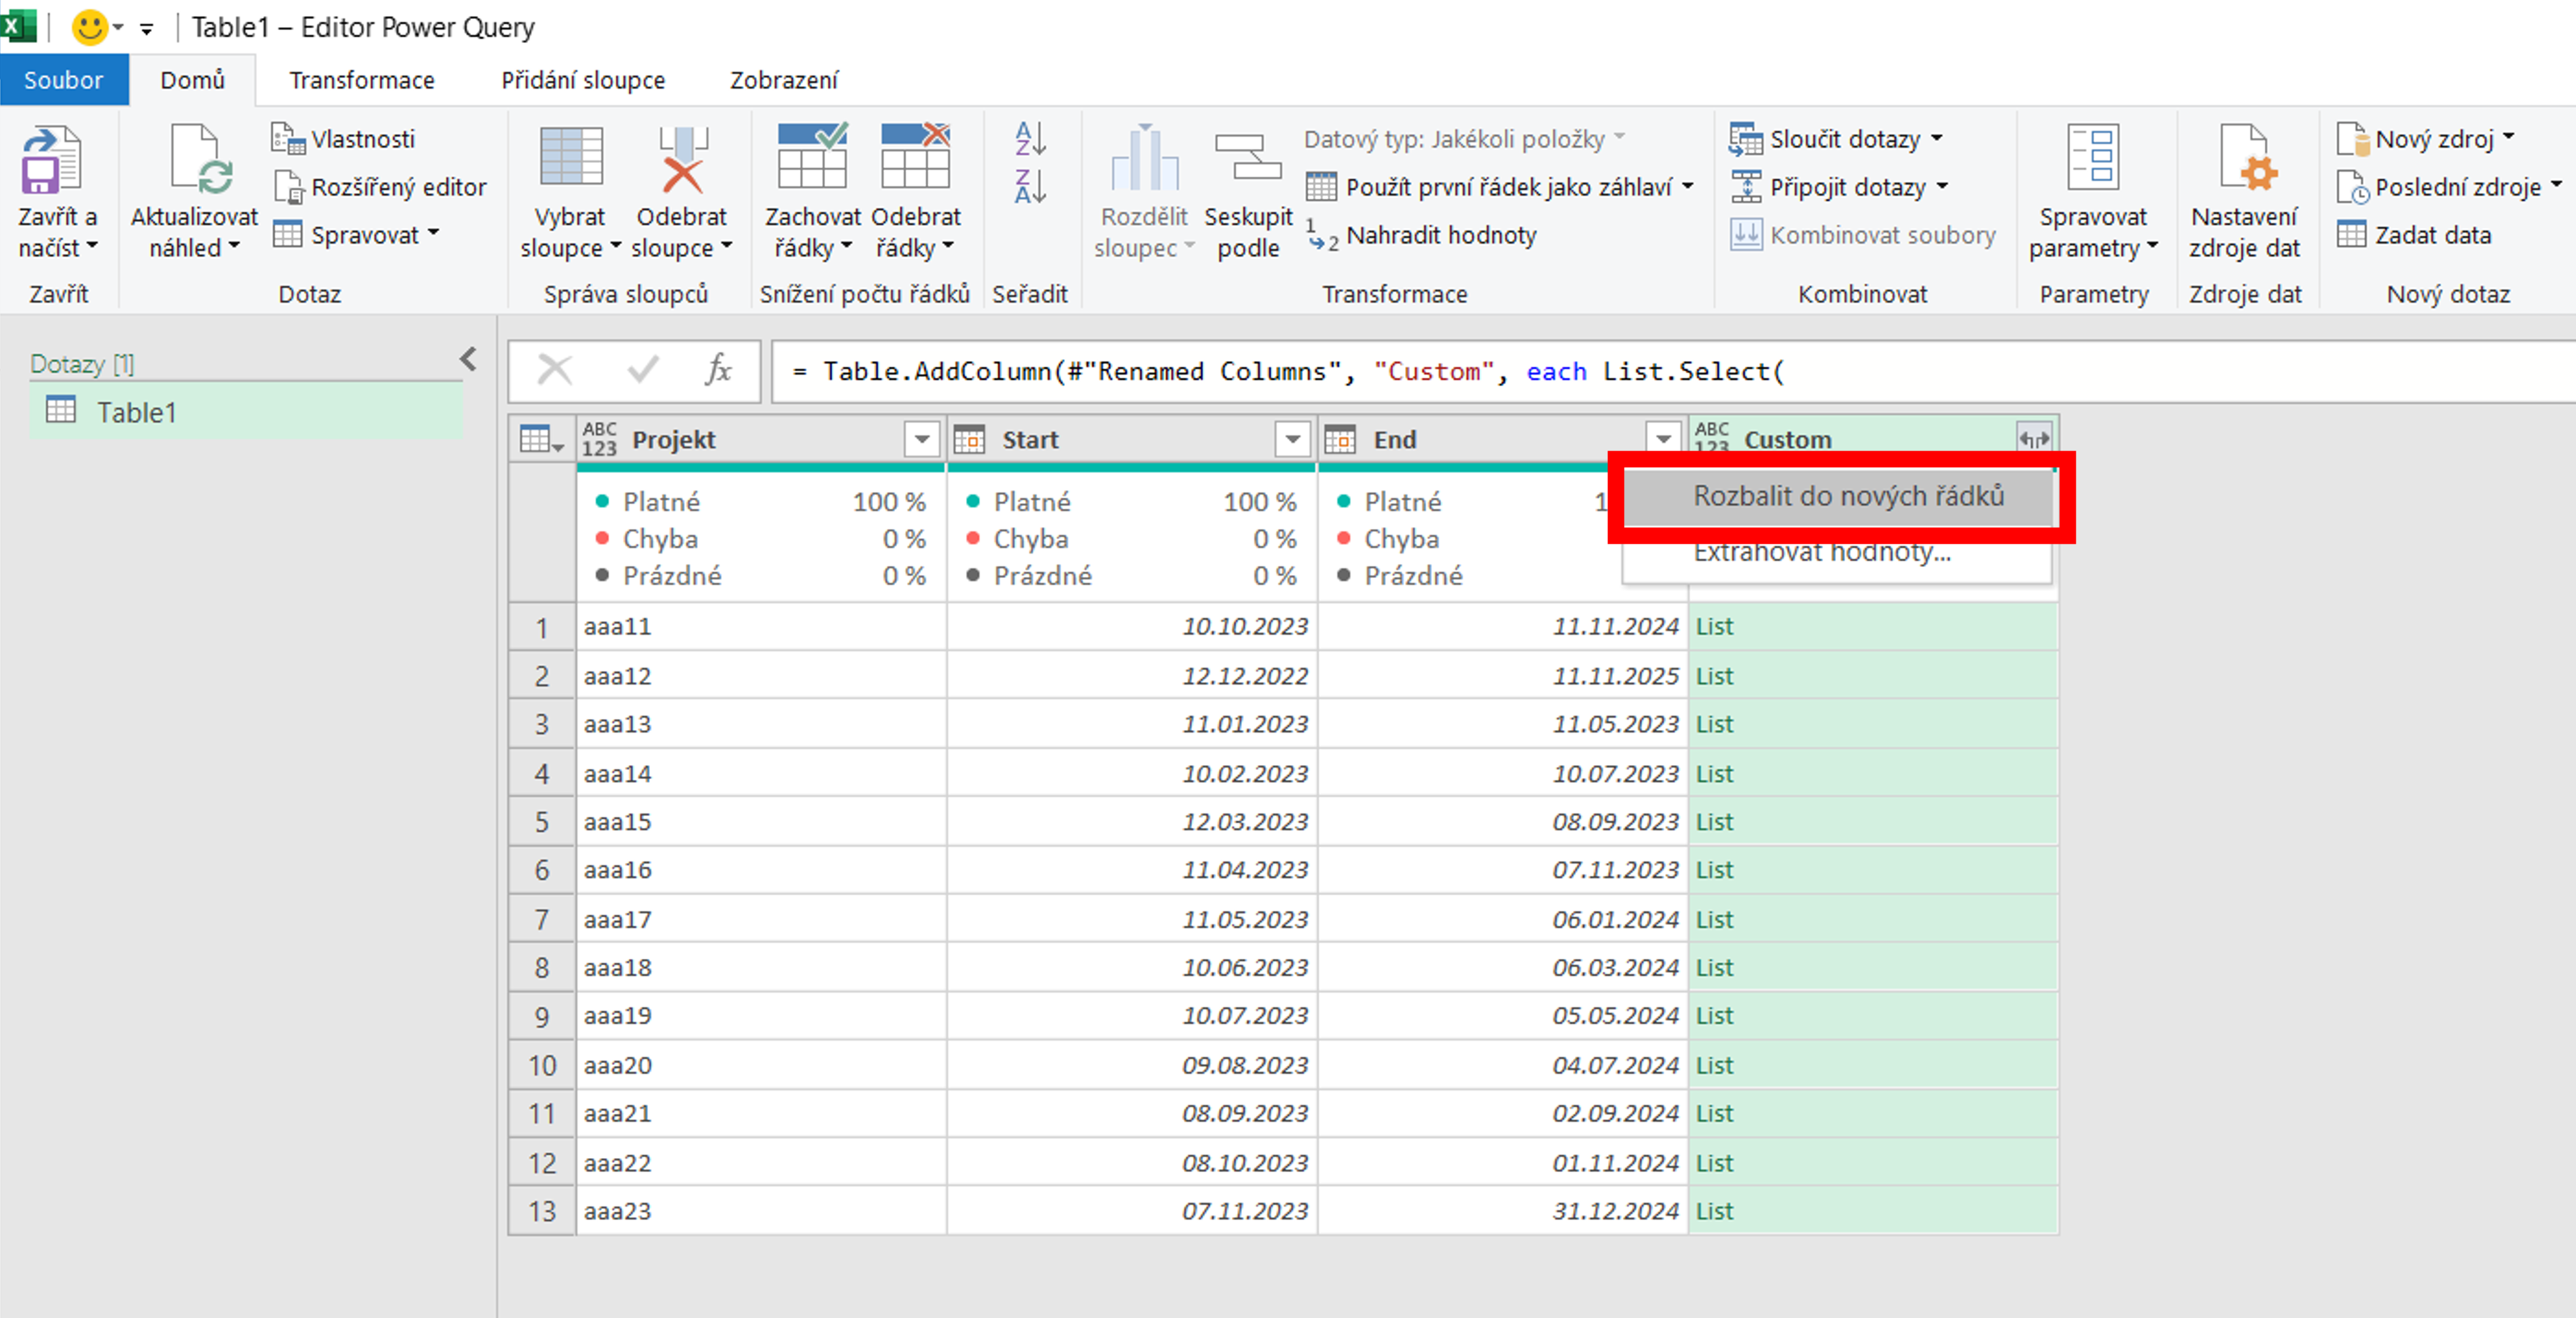
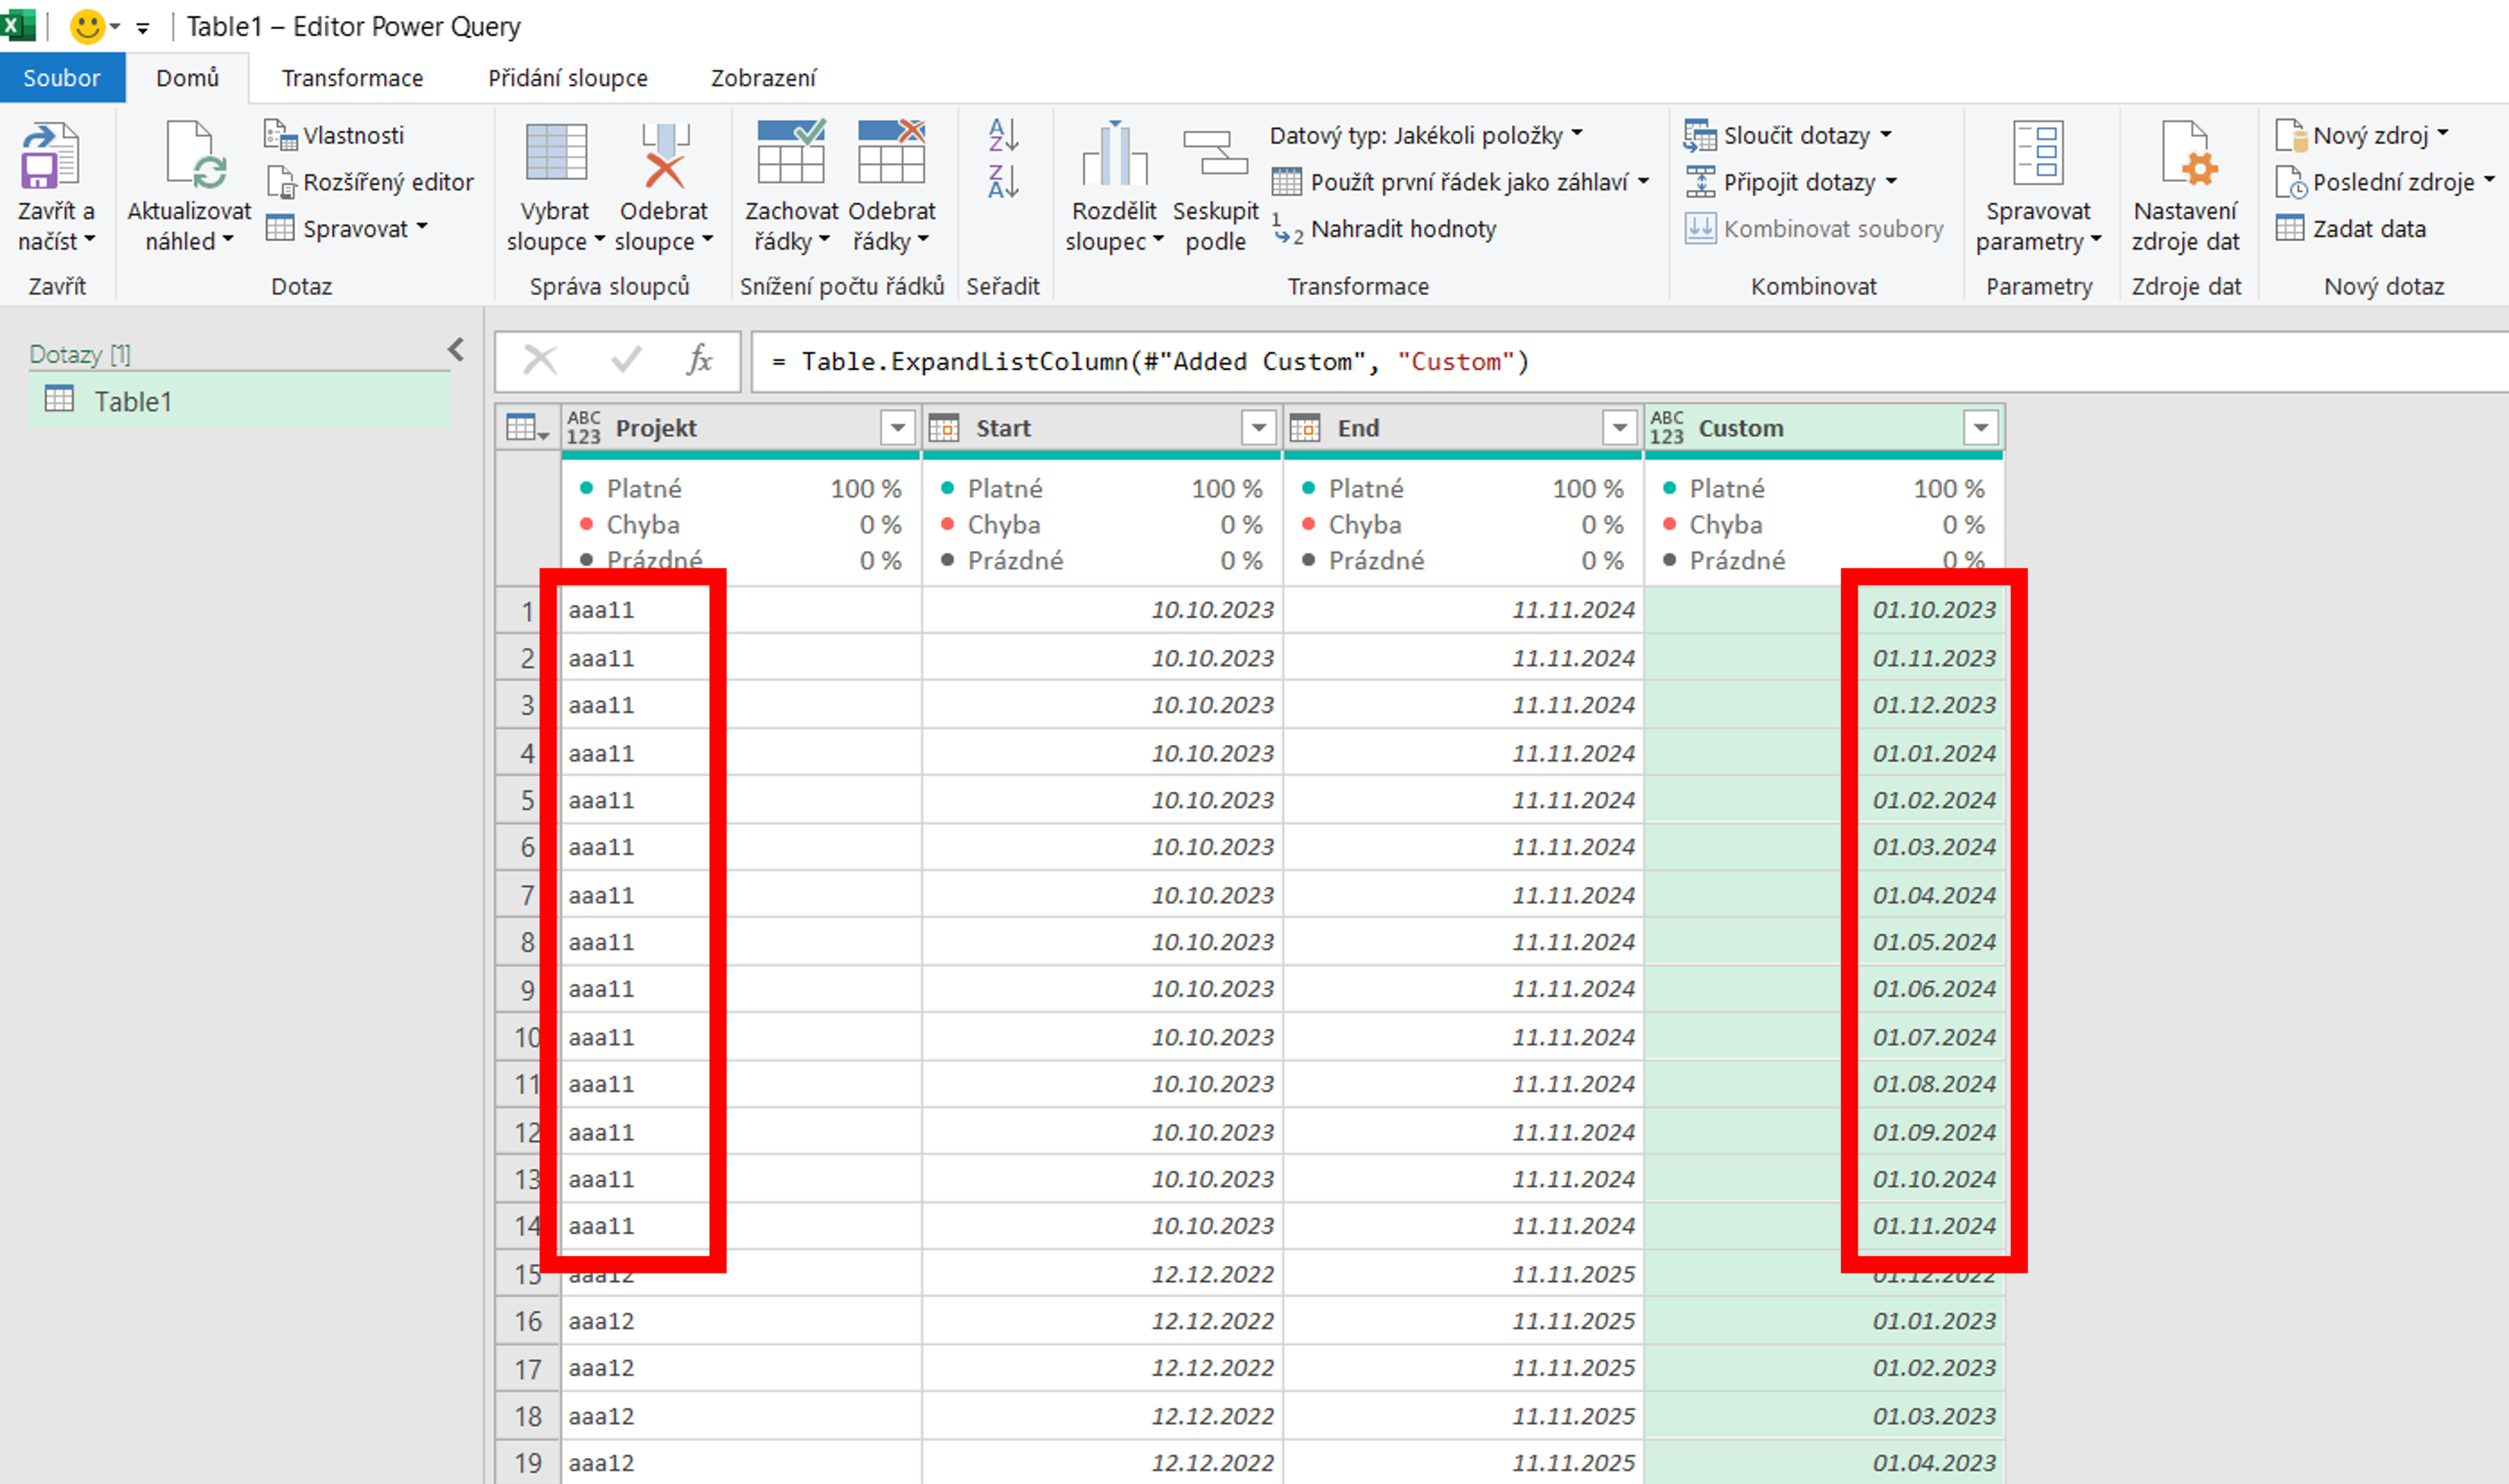
Now we have beginnings of months for all the period.
![]()
![]()
Pište kdykoliv. Odpovíme do 24h
![]()
© exceltown.com / 2006 - 2023 Vyrobilo studio bARTvisions s.r.o.