Našimi kurzy prošlo více než 10 000+ účastníků
2 392 ověřených referencí účastníků našich kurzů. Přesvědčte se sami
During consultations, I sometimes encounter a request that goes something like this:
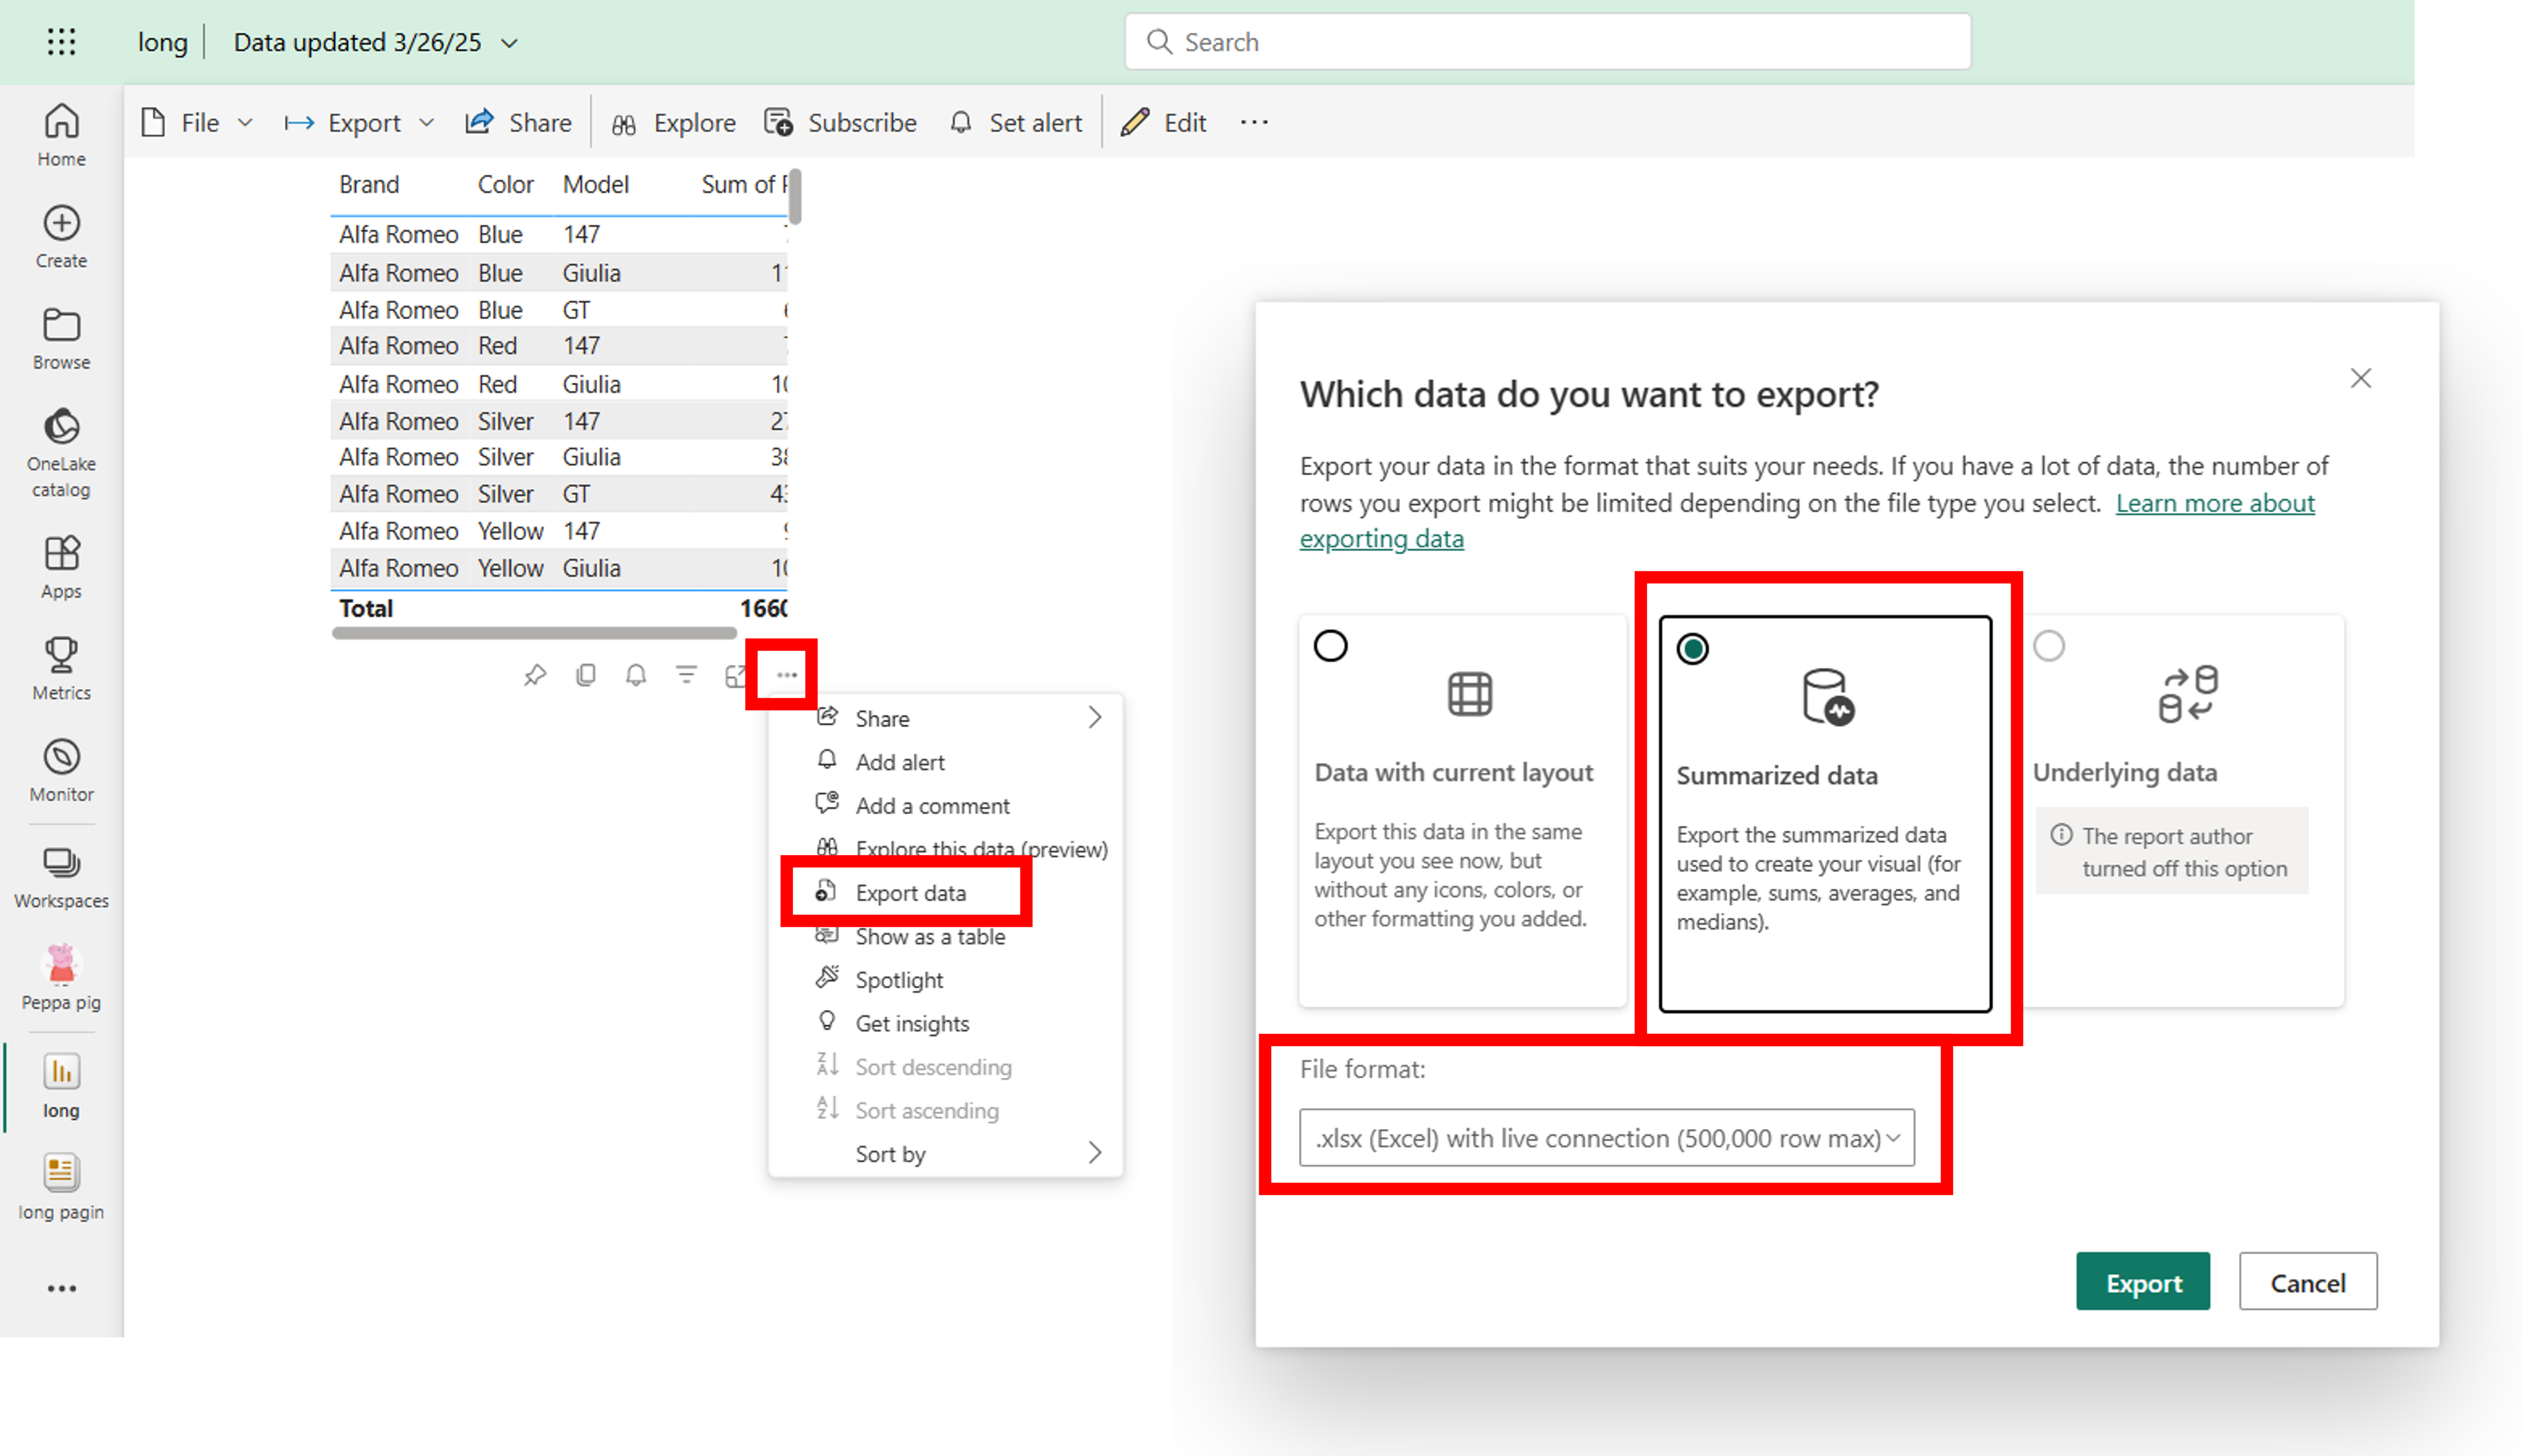
“Yeah, it’s great that Power BI can create beautiful dynamic reports – charts, tables, filters… But besides that, we need to create long printable tables from the data we have in Power BI. It could be some transaction list from the last year, a product price list, a list of employees… The point is that these tables have hundreds of rows and simply don’t fit on a standard report page. When exporting to PDF or printing, only first part is visible.”
Long tables are, of course, somewhat against the philosophy of Power BI. But when you’re a user and need to get something done, you don’t care about philosophy – you care about getting the result.
First – here’s what doesn’t work. It’s usually not worth trying to enlarge the report page. While technically possible, the length doesn’t adjust to the content, headers are missing in the PDF, and overall it’s just not usable.
There are two better paths – Excel and Paginated Reports.
Excel is perfect for long tables. It’s easy to ensure that headers appear correctly in print/PDF, column names repeat etc.
A good idea is to use Excel instead of Power BI (typically, but not necessarily, with Power Query and Power Pivot, which gives you almost the same calculation capabilities as Power BI). It’s a bit old-school, but a very effective solution. In my opinion, the simplest one.

But what if you already have your data in powerbi.com and don’t want to simultaneously connect, clean, and store them again in Excel?
This next option is great, even though not many people use it. You can connect Excel to data from powerbi.com. This way, you get 100% of the data capabilities from powerbi.com and 100% of Excel’s formatting tools.
Excel can either be connected to the entire data model, resulting in a pivot table from the whole model:

Or it can come from a specific table visual (more info here):
The result is a standard Excel file:
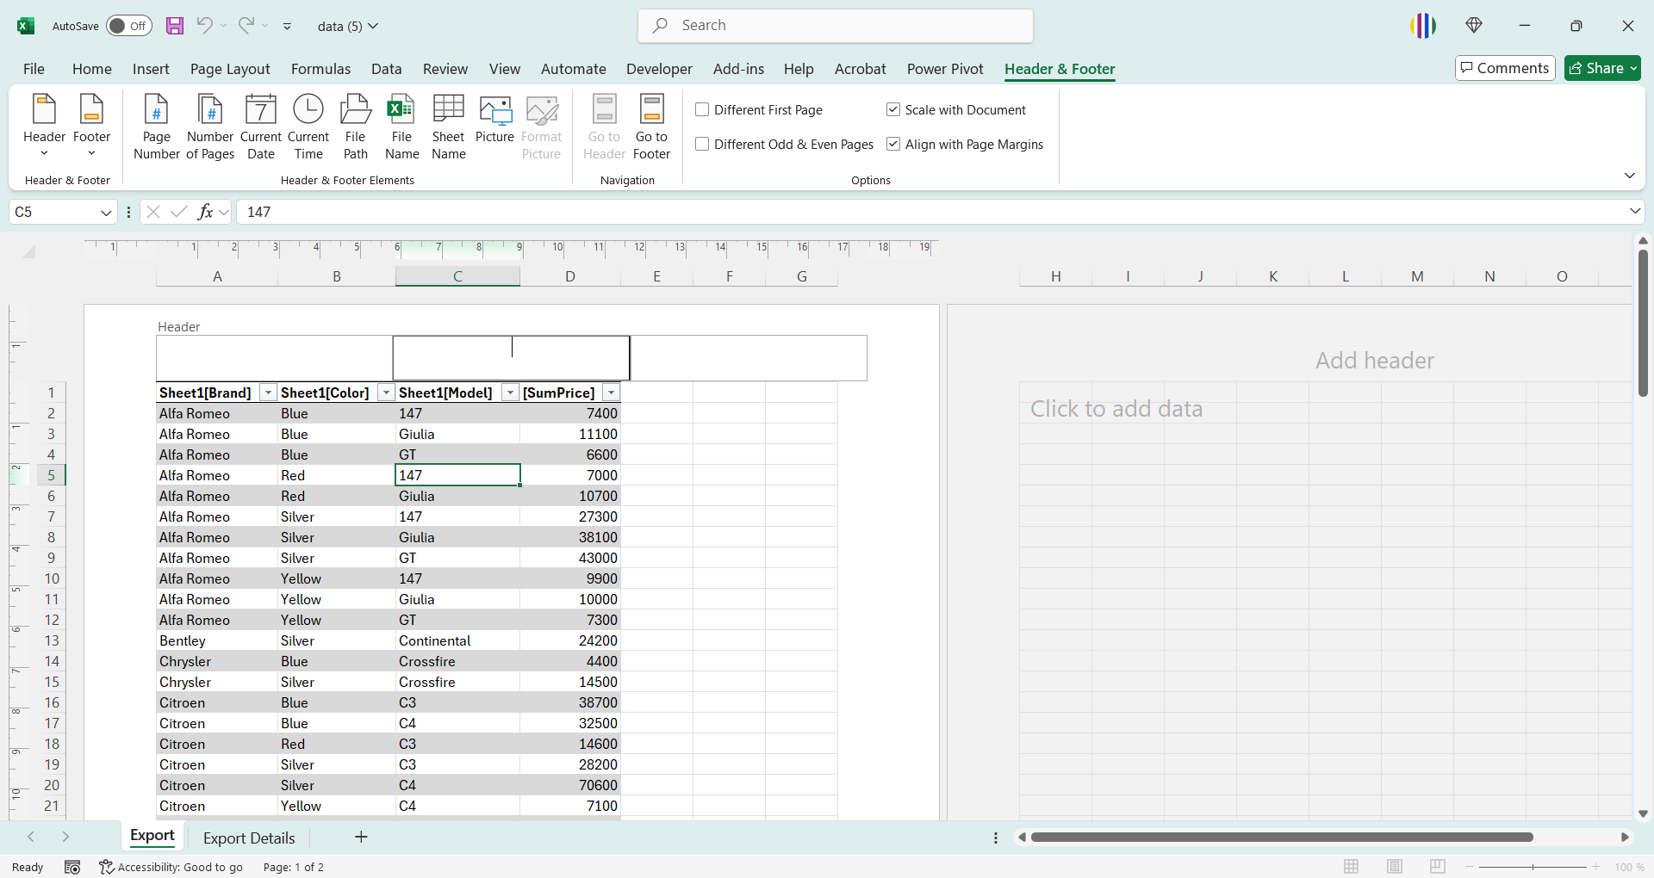
Both options are trivial, “one click”, and the data remains live – just refresh the query to update.
Paginated visuals are usually not created in Power BI Desktop, but directly on published data in powerbi.com.
You can easily create your “long table”, and it will be saved in the workspace just like a regular report.
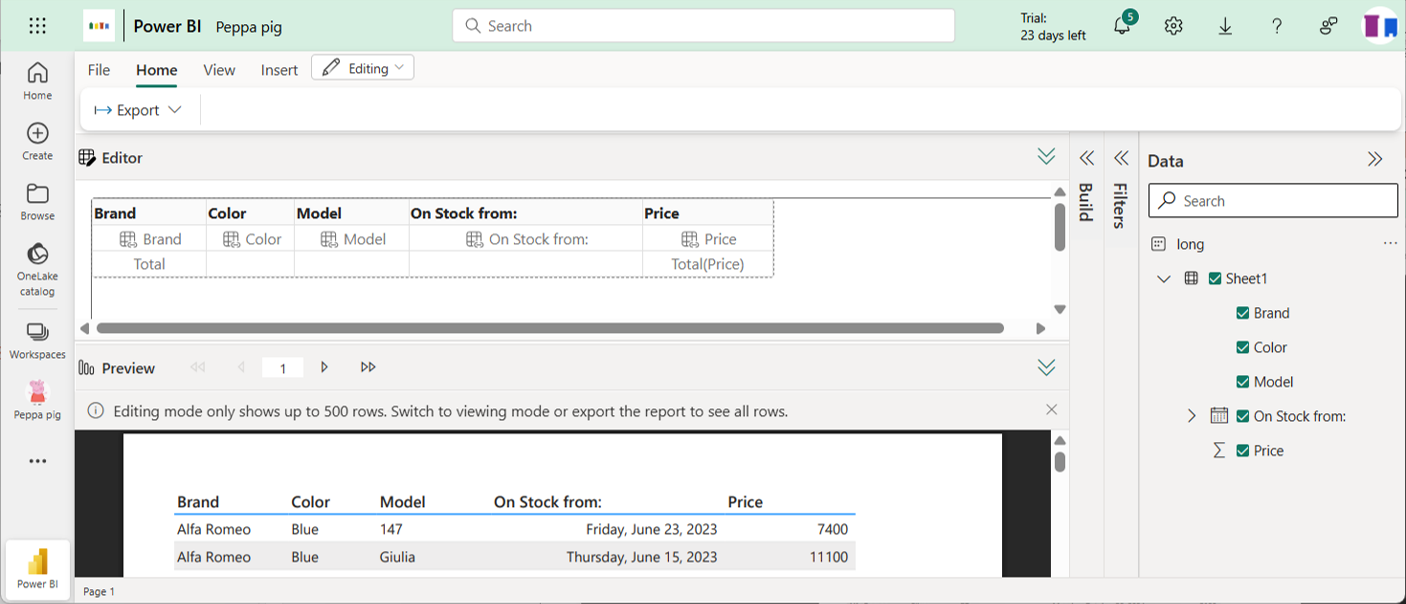
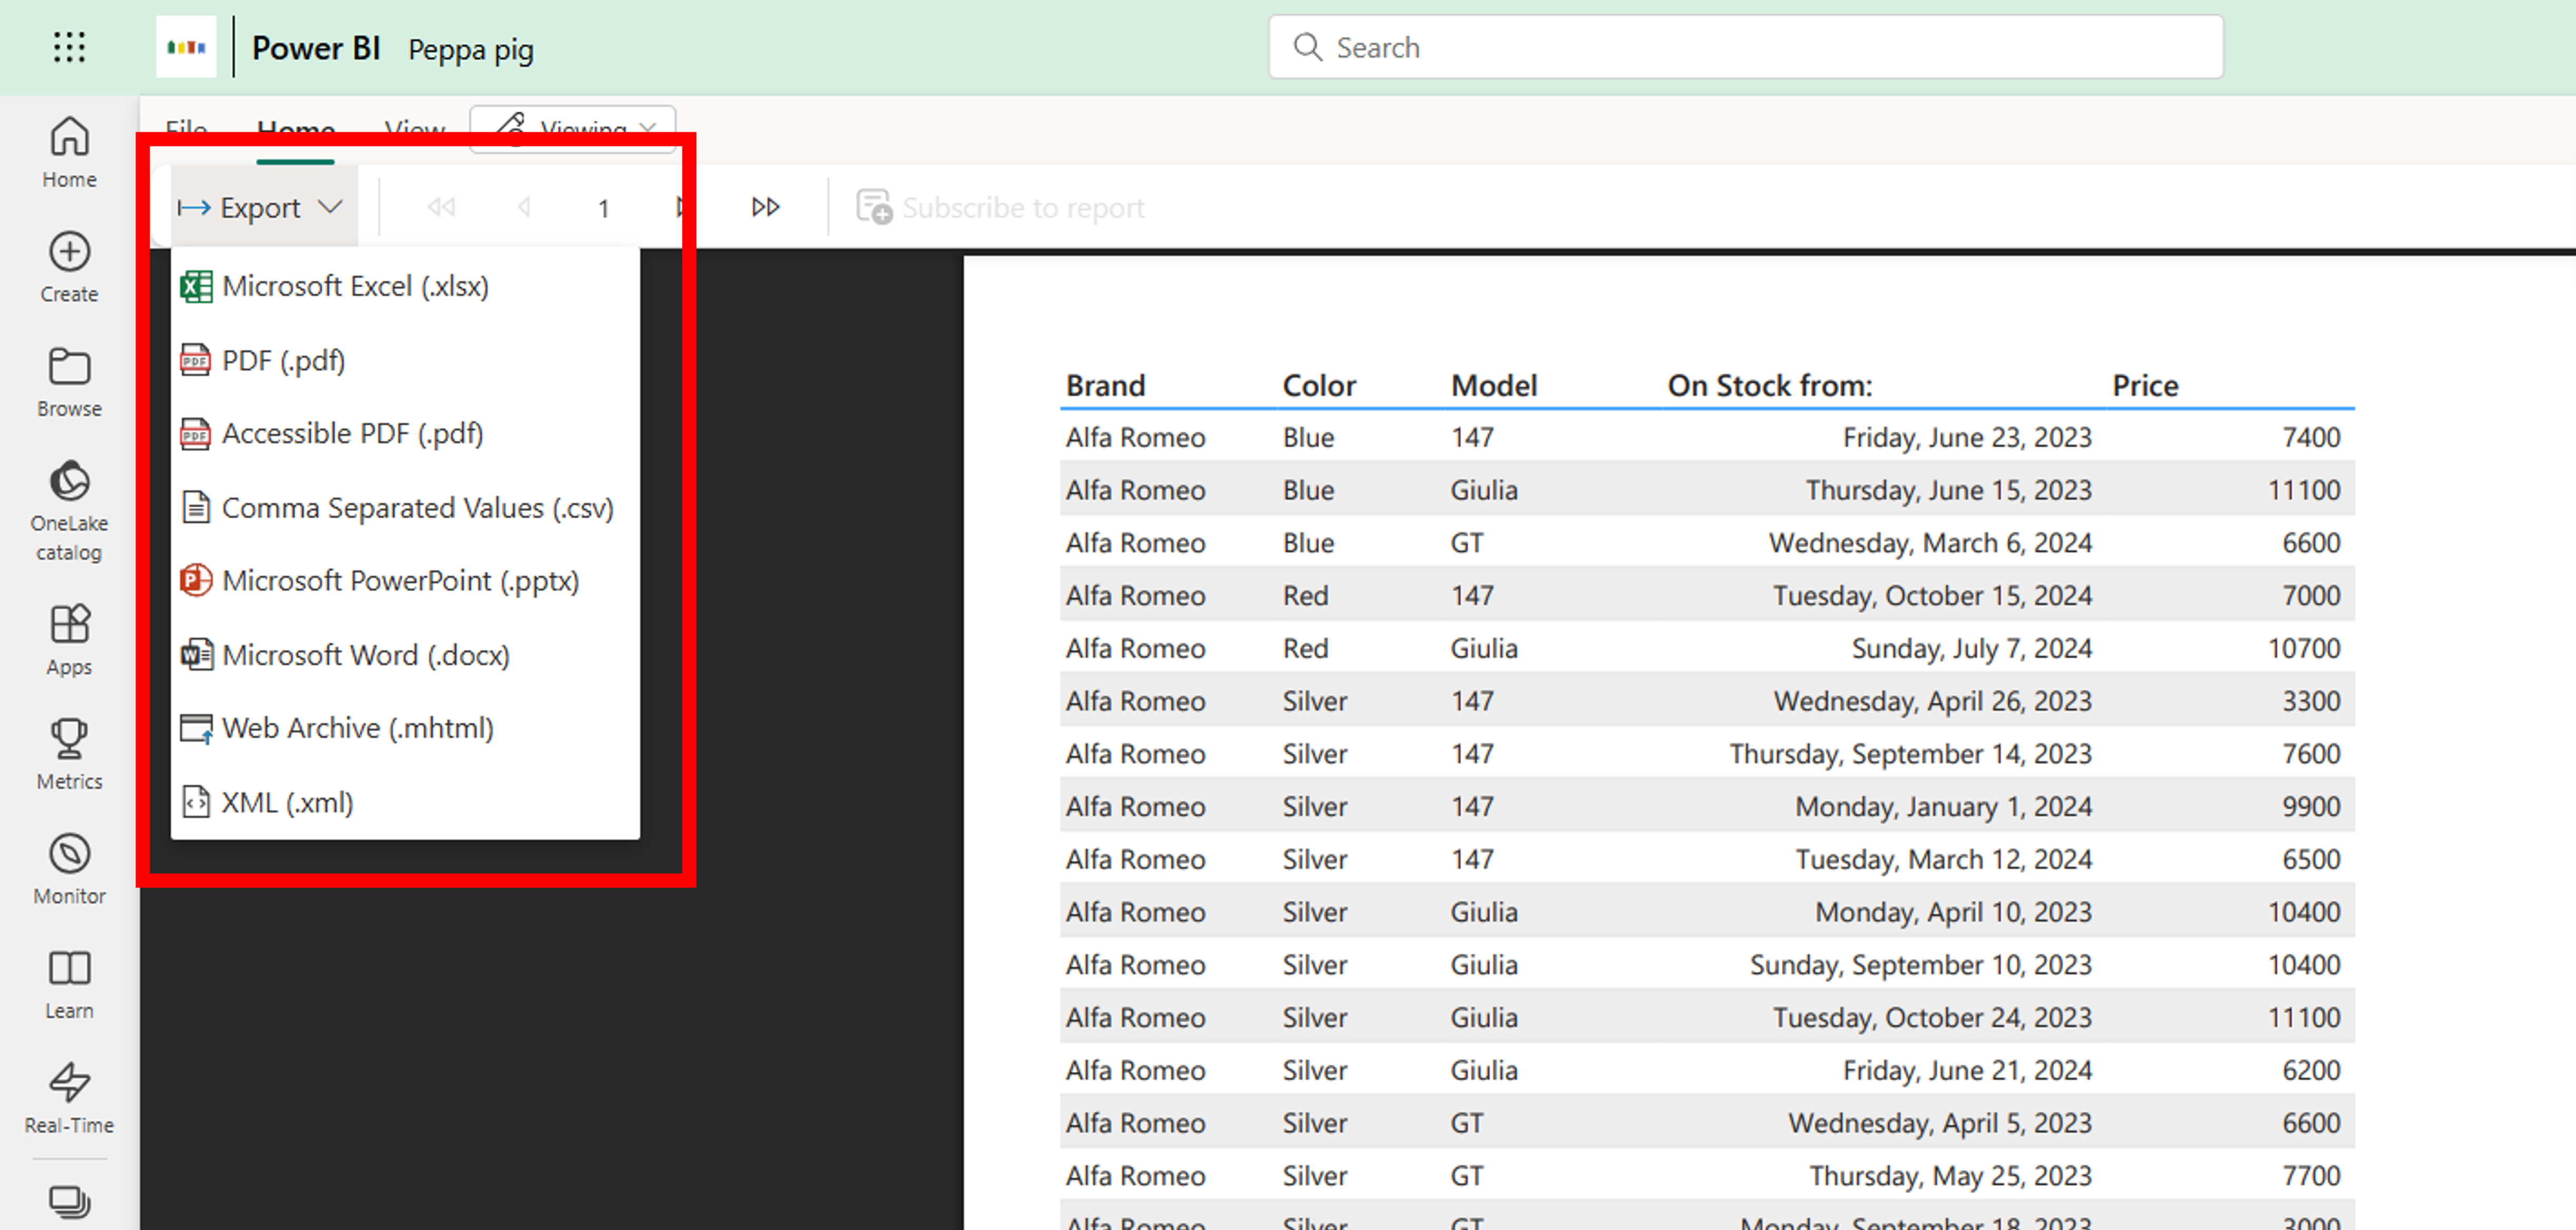
Compared to a standard report, it is perfectly printable and you can export it to many types documents.
![]()
![]()
Pište kdykoliv. Odpovíme do 24h
![]()
© exceltown.com / 2006 - 2023 Vyrobilo studio bARTvisions s.r.o.