Našimi kurzy prošlo více než 10 000+ účastníků
2 392 ověřených referencí účastníků našich kurzů. Přesvědčte se sami
This article shows how to create very simple report in Power BI Desktop and publish it.
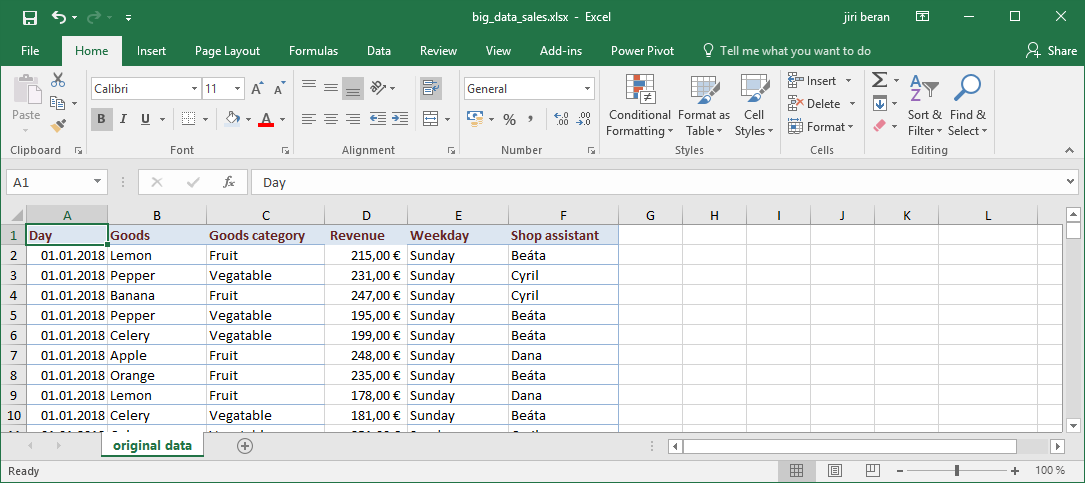
Let´s use this table, stored as an xlsx file. There are information about company sales. We´d like to see the revenue grouped by employees.
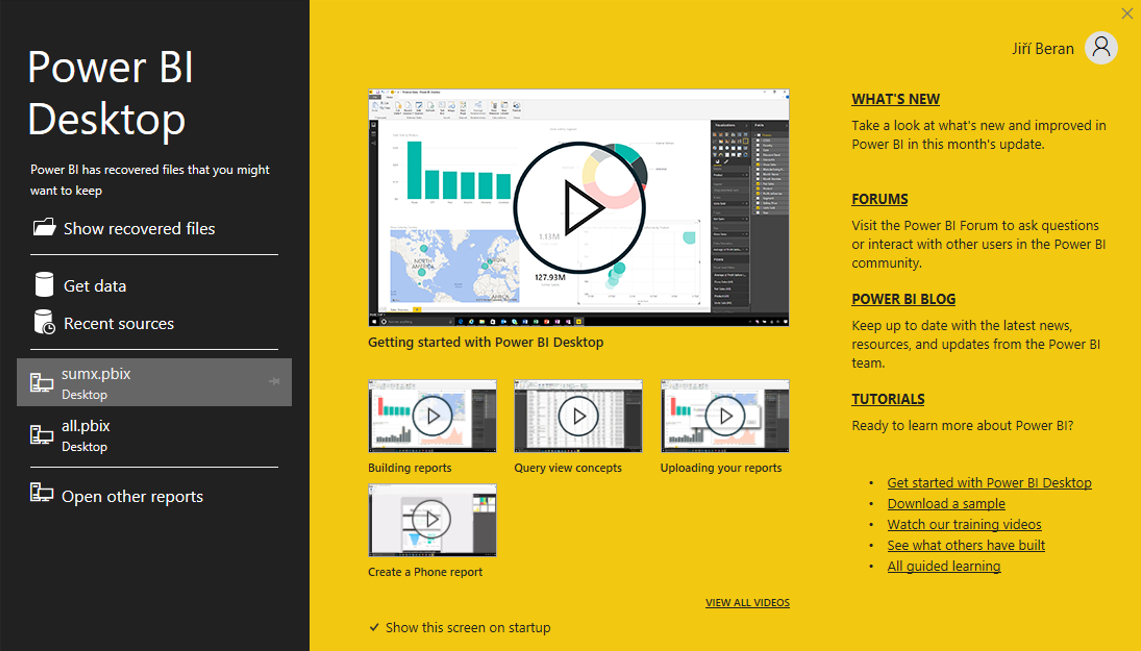
Open the Power BI tool. (If you don´t have i so fare, download it for free)
Select the xlsx file.
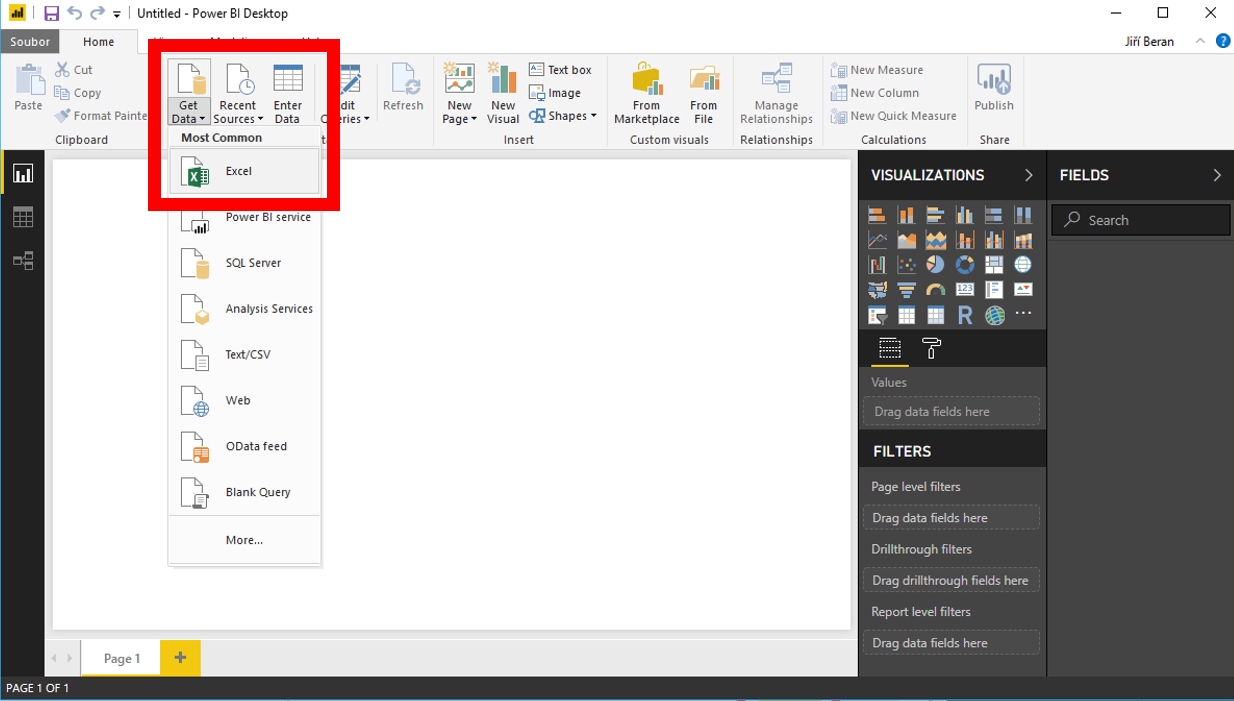
Select the sheet or table.

Select Load, which loads the data.
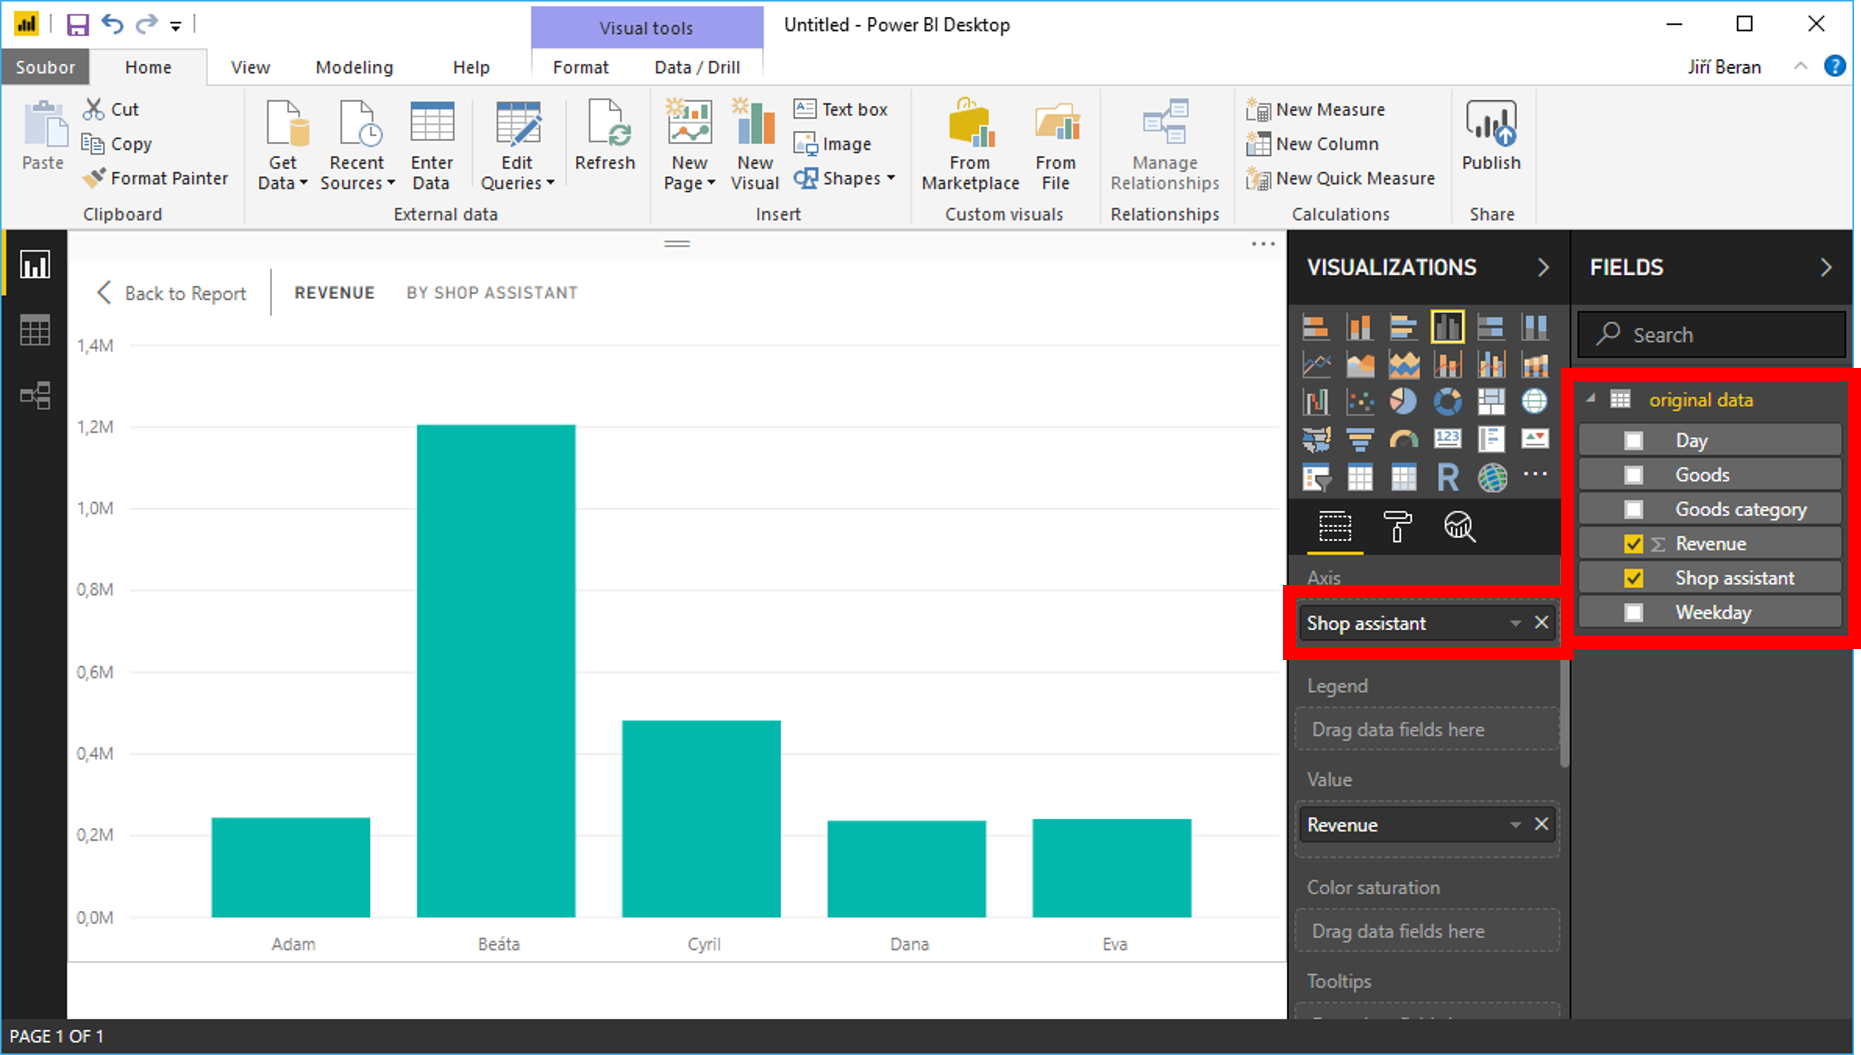
On the left side click on chart icon. On the left side select some of the charts. Check “Revenue” and “Shop assistant”.
New chart appears. It can be modified to pivot table, other type or chart etc…
Let´s say the report is finished and we can publish it to a powerbi.com cloud.
Click on Publish, save the file and sign in (if necessary). Then click on “Open … in Power BI”.
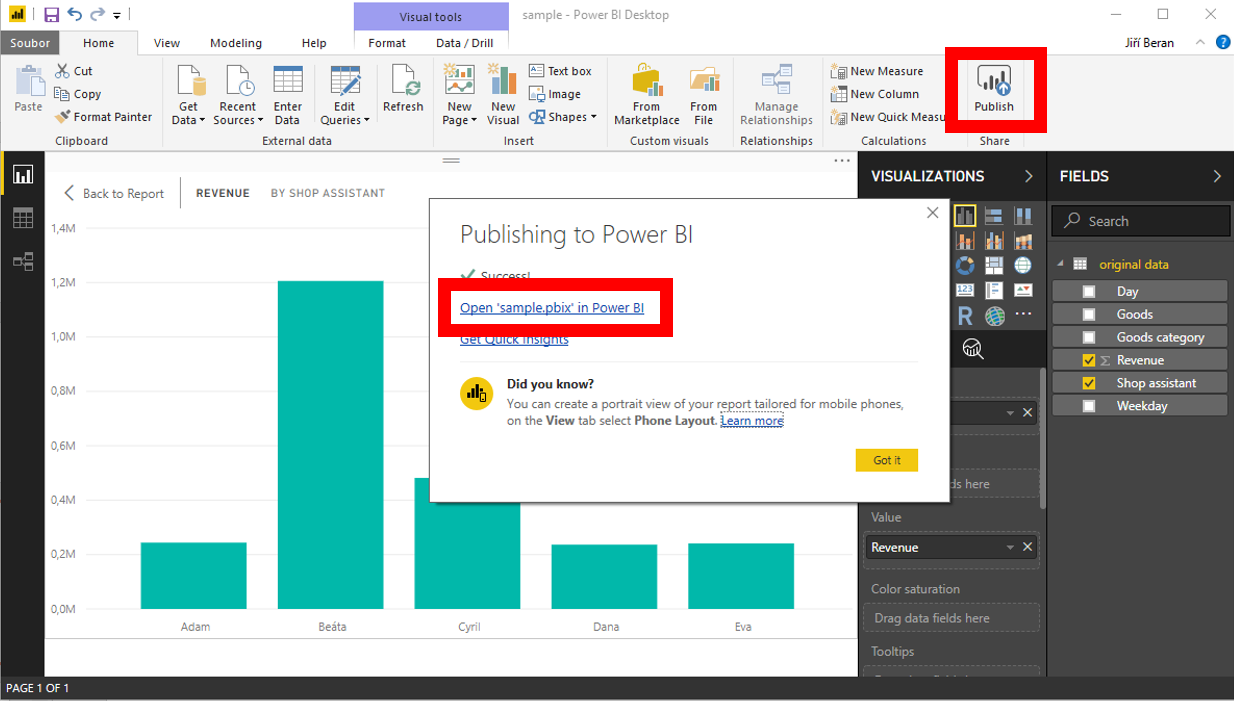
Now the report is sent to the world and we are finished. 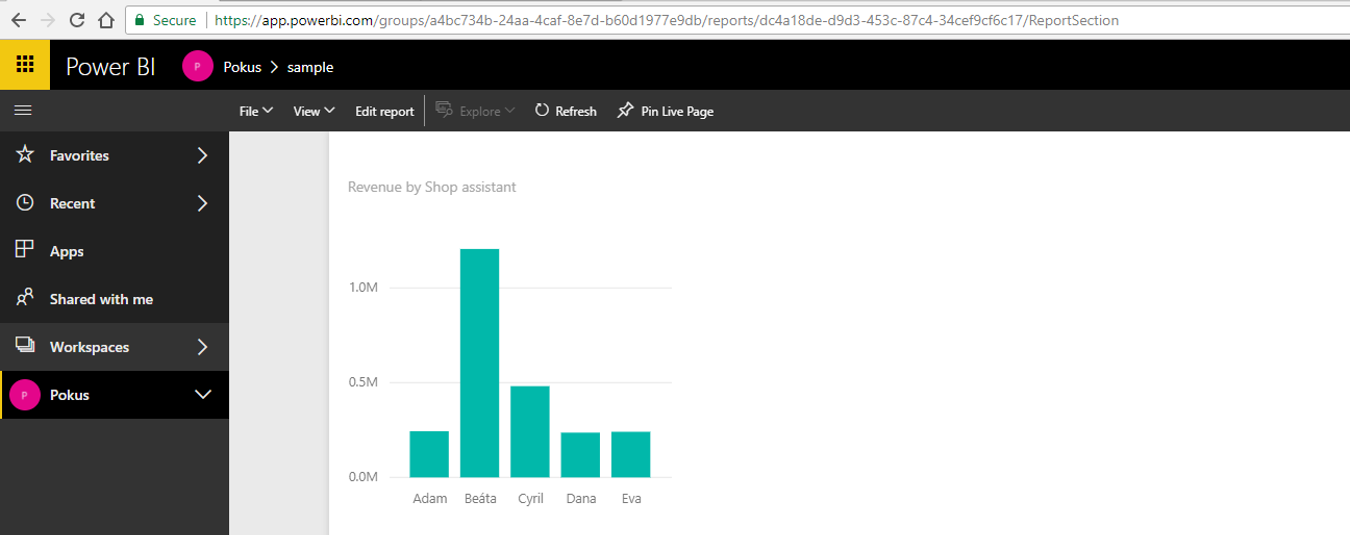
![]()
![]()
Pište kdykoliv. Odpovíme do 24h
![]()
© exceltown.com / 2006 - 2023 Vyrobilo studio bARTvisions s.r.o.