Našimi kurzy prošlo více než 10 000+ účastníků
2 392 ověřených referencí účastníků našich kurzů. Přesvědčte se sami
This article explains how Calculation Groups work in Power BI.
Using them significantly simplifies working with measures by enabling the creation of “variants” of measures.
How does it work?
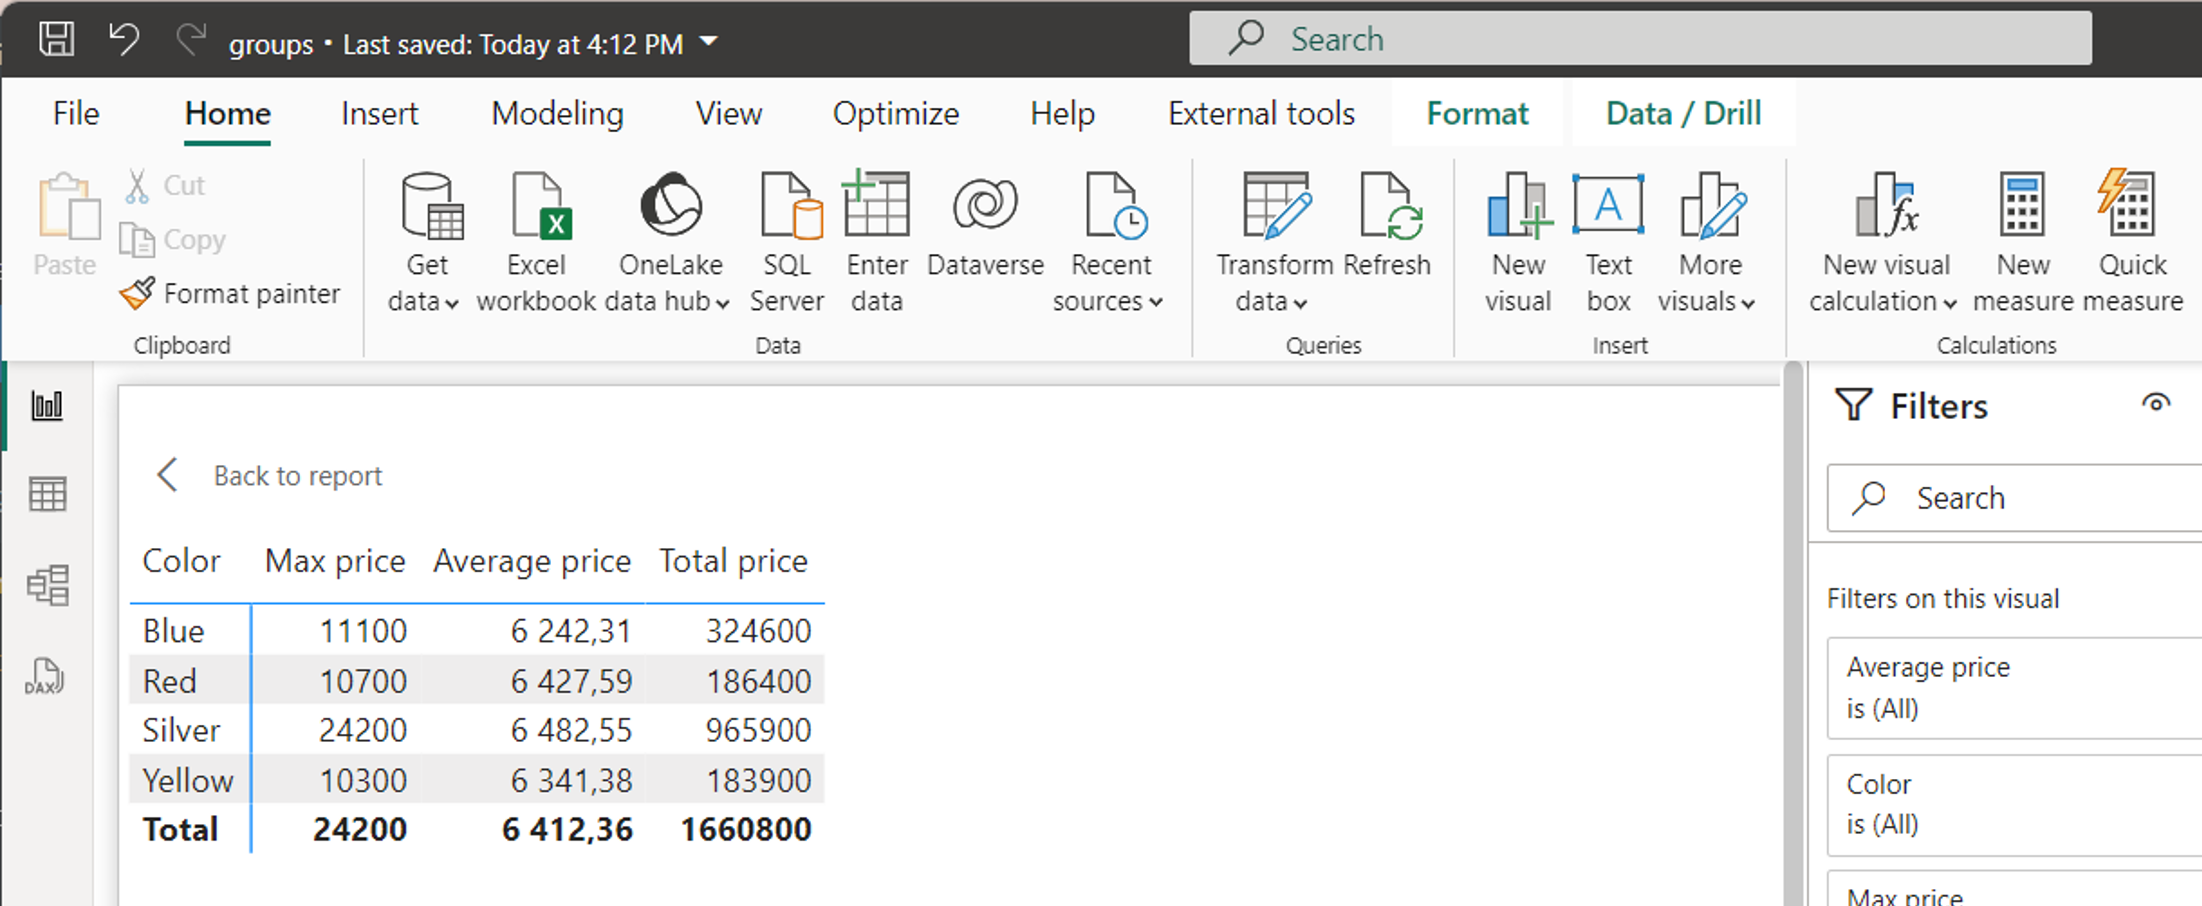
Imagine you’re calculating several measures from your data, such as total, average, and maximum revenue.
These values are tax-free. You want to analyze them with a 21% tax included (in practice, you might use a more complex calculation, for instance, with Time Intelligence functions).
Normally, this would mean creating a tax-included variant for each measure (e.g., total with tax, average with tax, maximum with tax). The original three measures would double in number. With similar calculations, this number would grow exponentially, making it hard to manage.
A Calculation Group is a general calculation applied to multiple input measures but defined only once.
This allows you to achieve a result like this while using just the three original measures and one Calculation Group.
You can create a group by clicking a button and writing a formula, such as this:
“SELECTEDMEASURE” in this formula represents the calculation where individual measures will be substituted. Each group contains multiple items with different calculation variants, such as with or without tax.
 Then you can use the group as a distinct column:
Or navigate through it using slicer:
2 392 ověřených referencí účastníků našich kurzů. Přesvědčte se sami
![]()
![]()
Pište kdykoliv. Odpovíme do 24h
© exceltown.com / 2006 - 2023 Vyrobilo studio bARTvisions s.r.o.