Našimi kurzy prošlo více než 10 000+ účastníků
2 392 ověřených referencí účastníků našich kurzů. Přesvědčte se sami
This article describes, how not to show subtotals in visualizations (typically in matrixes / pivot tables).
For example here we are going to keep blank subtotals for average price of Brand – but we still need to show the total price.
(If we didn´t need the total price, it would be easier to switch off subtotals in visual settings. But now some subtotals have to be visible and some have to be hidden.)
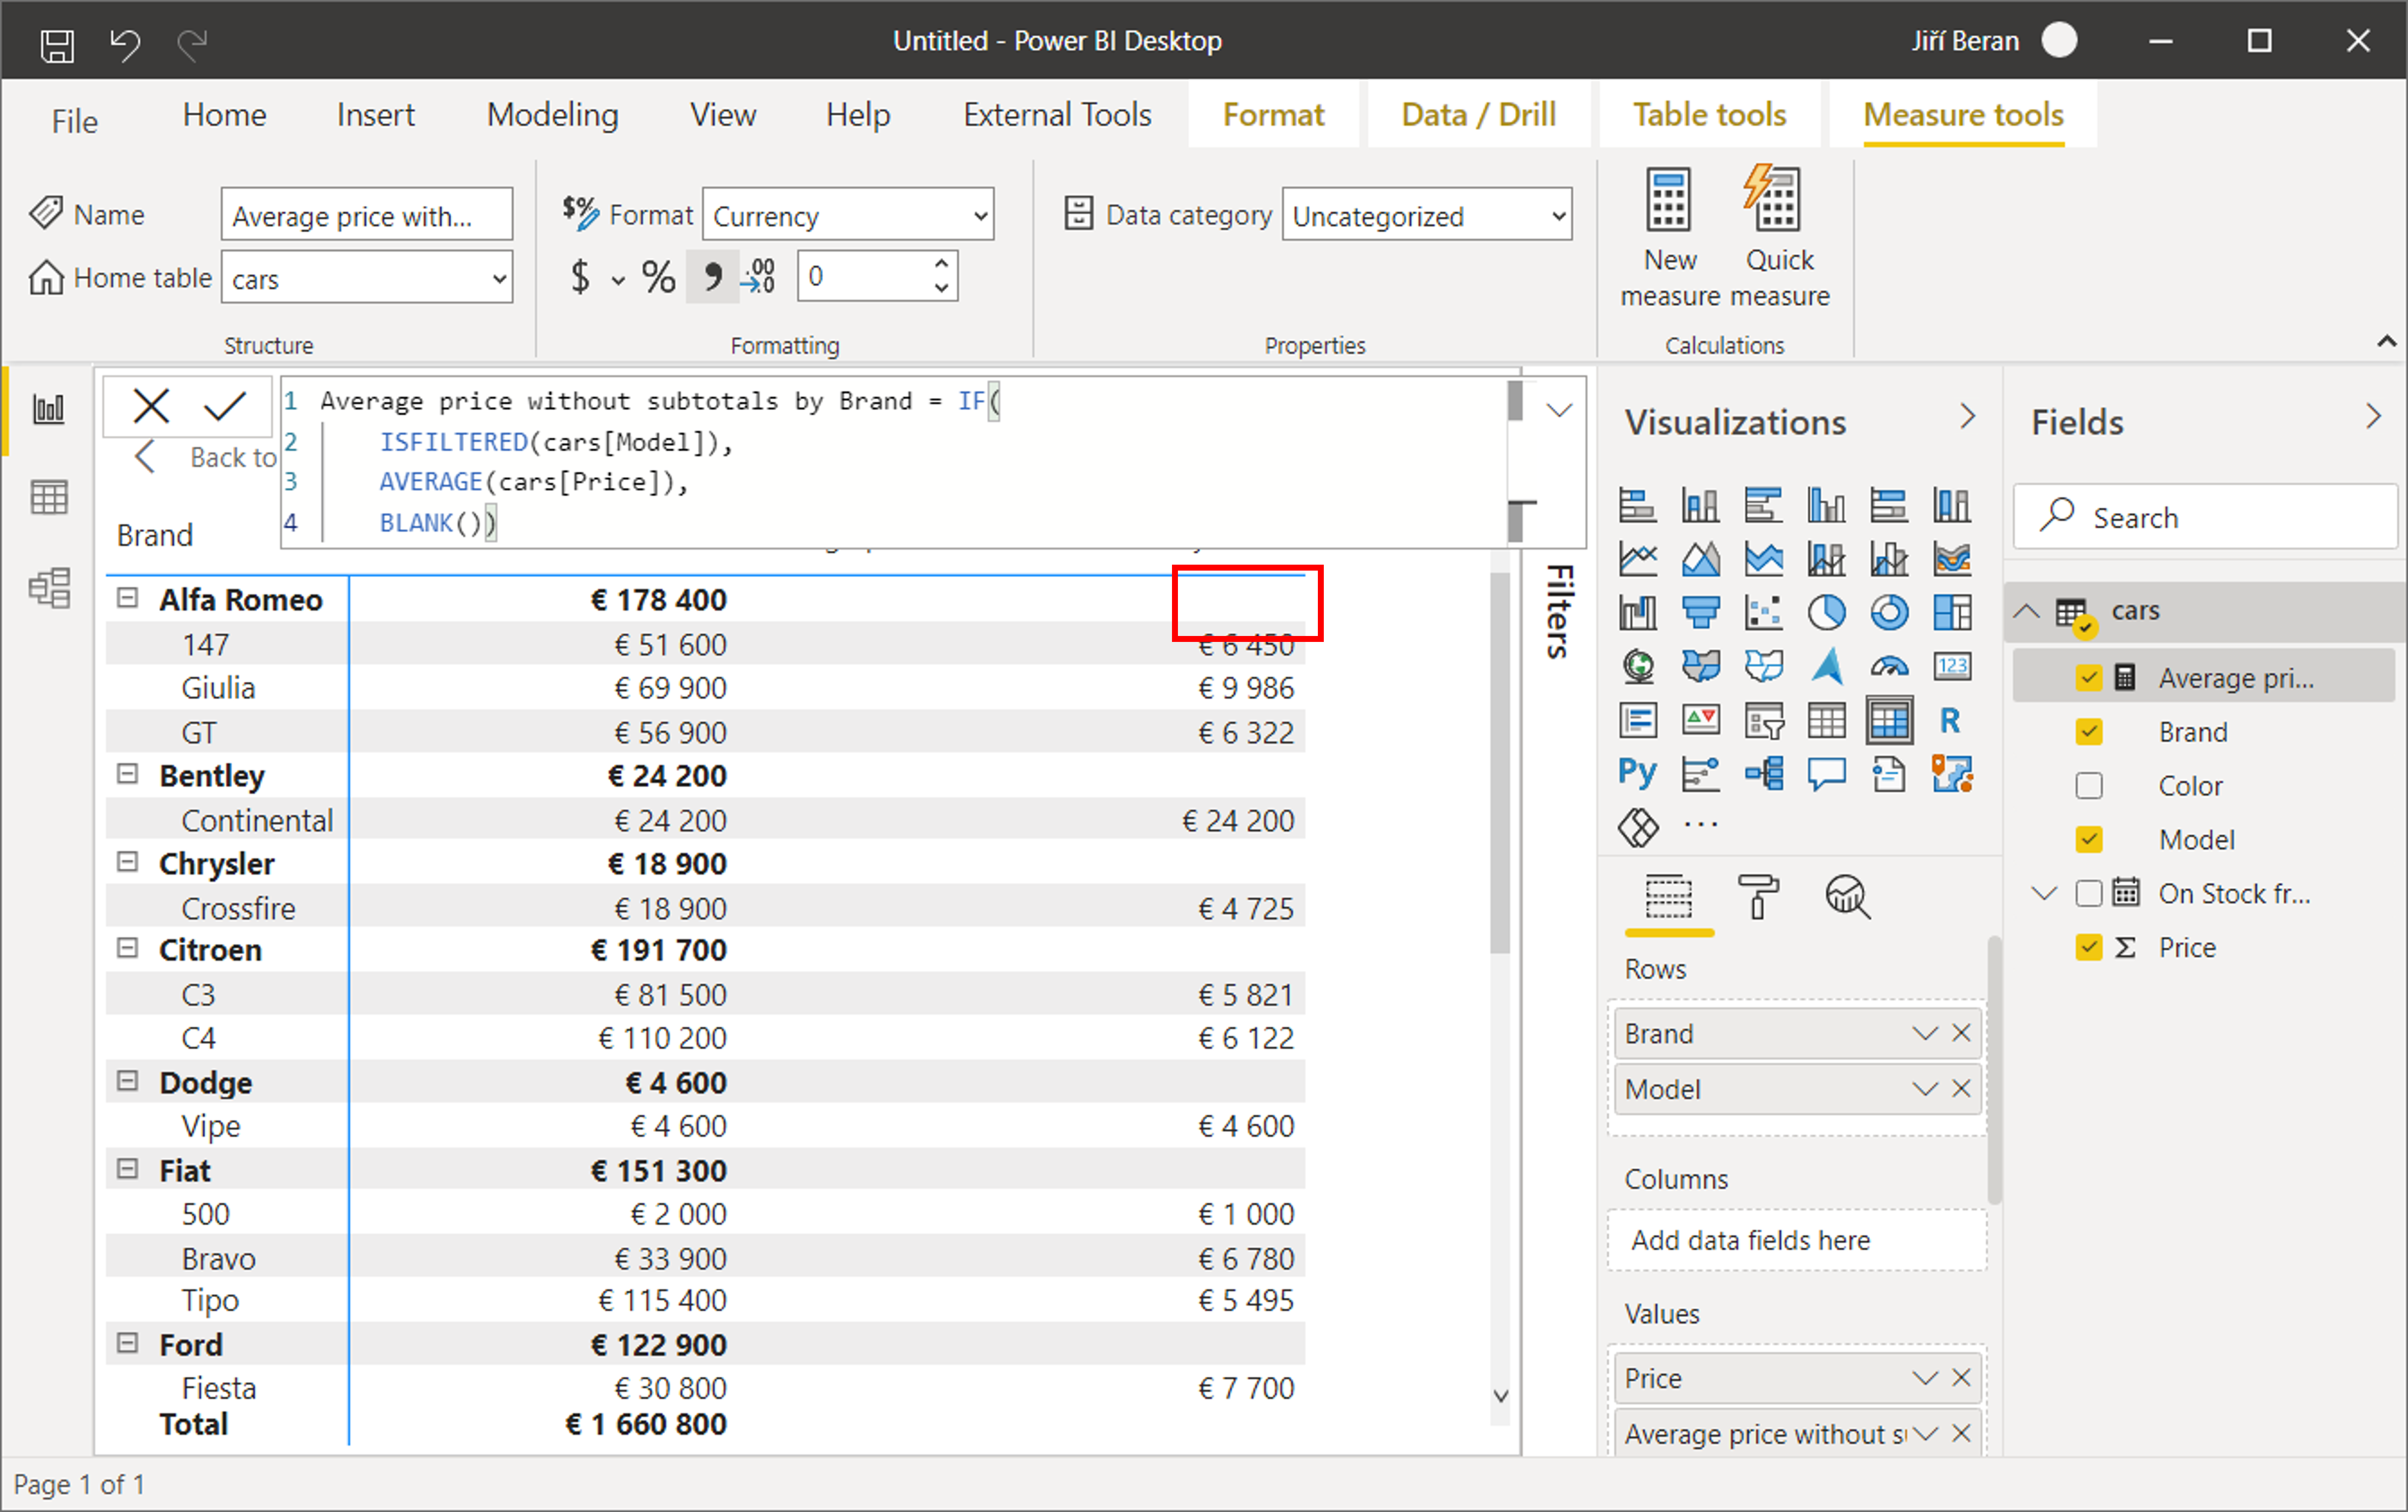
Average is calculated by this measure:
Because:
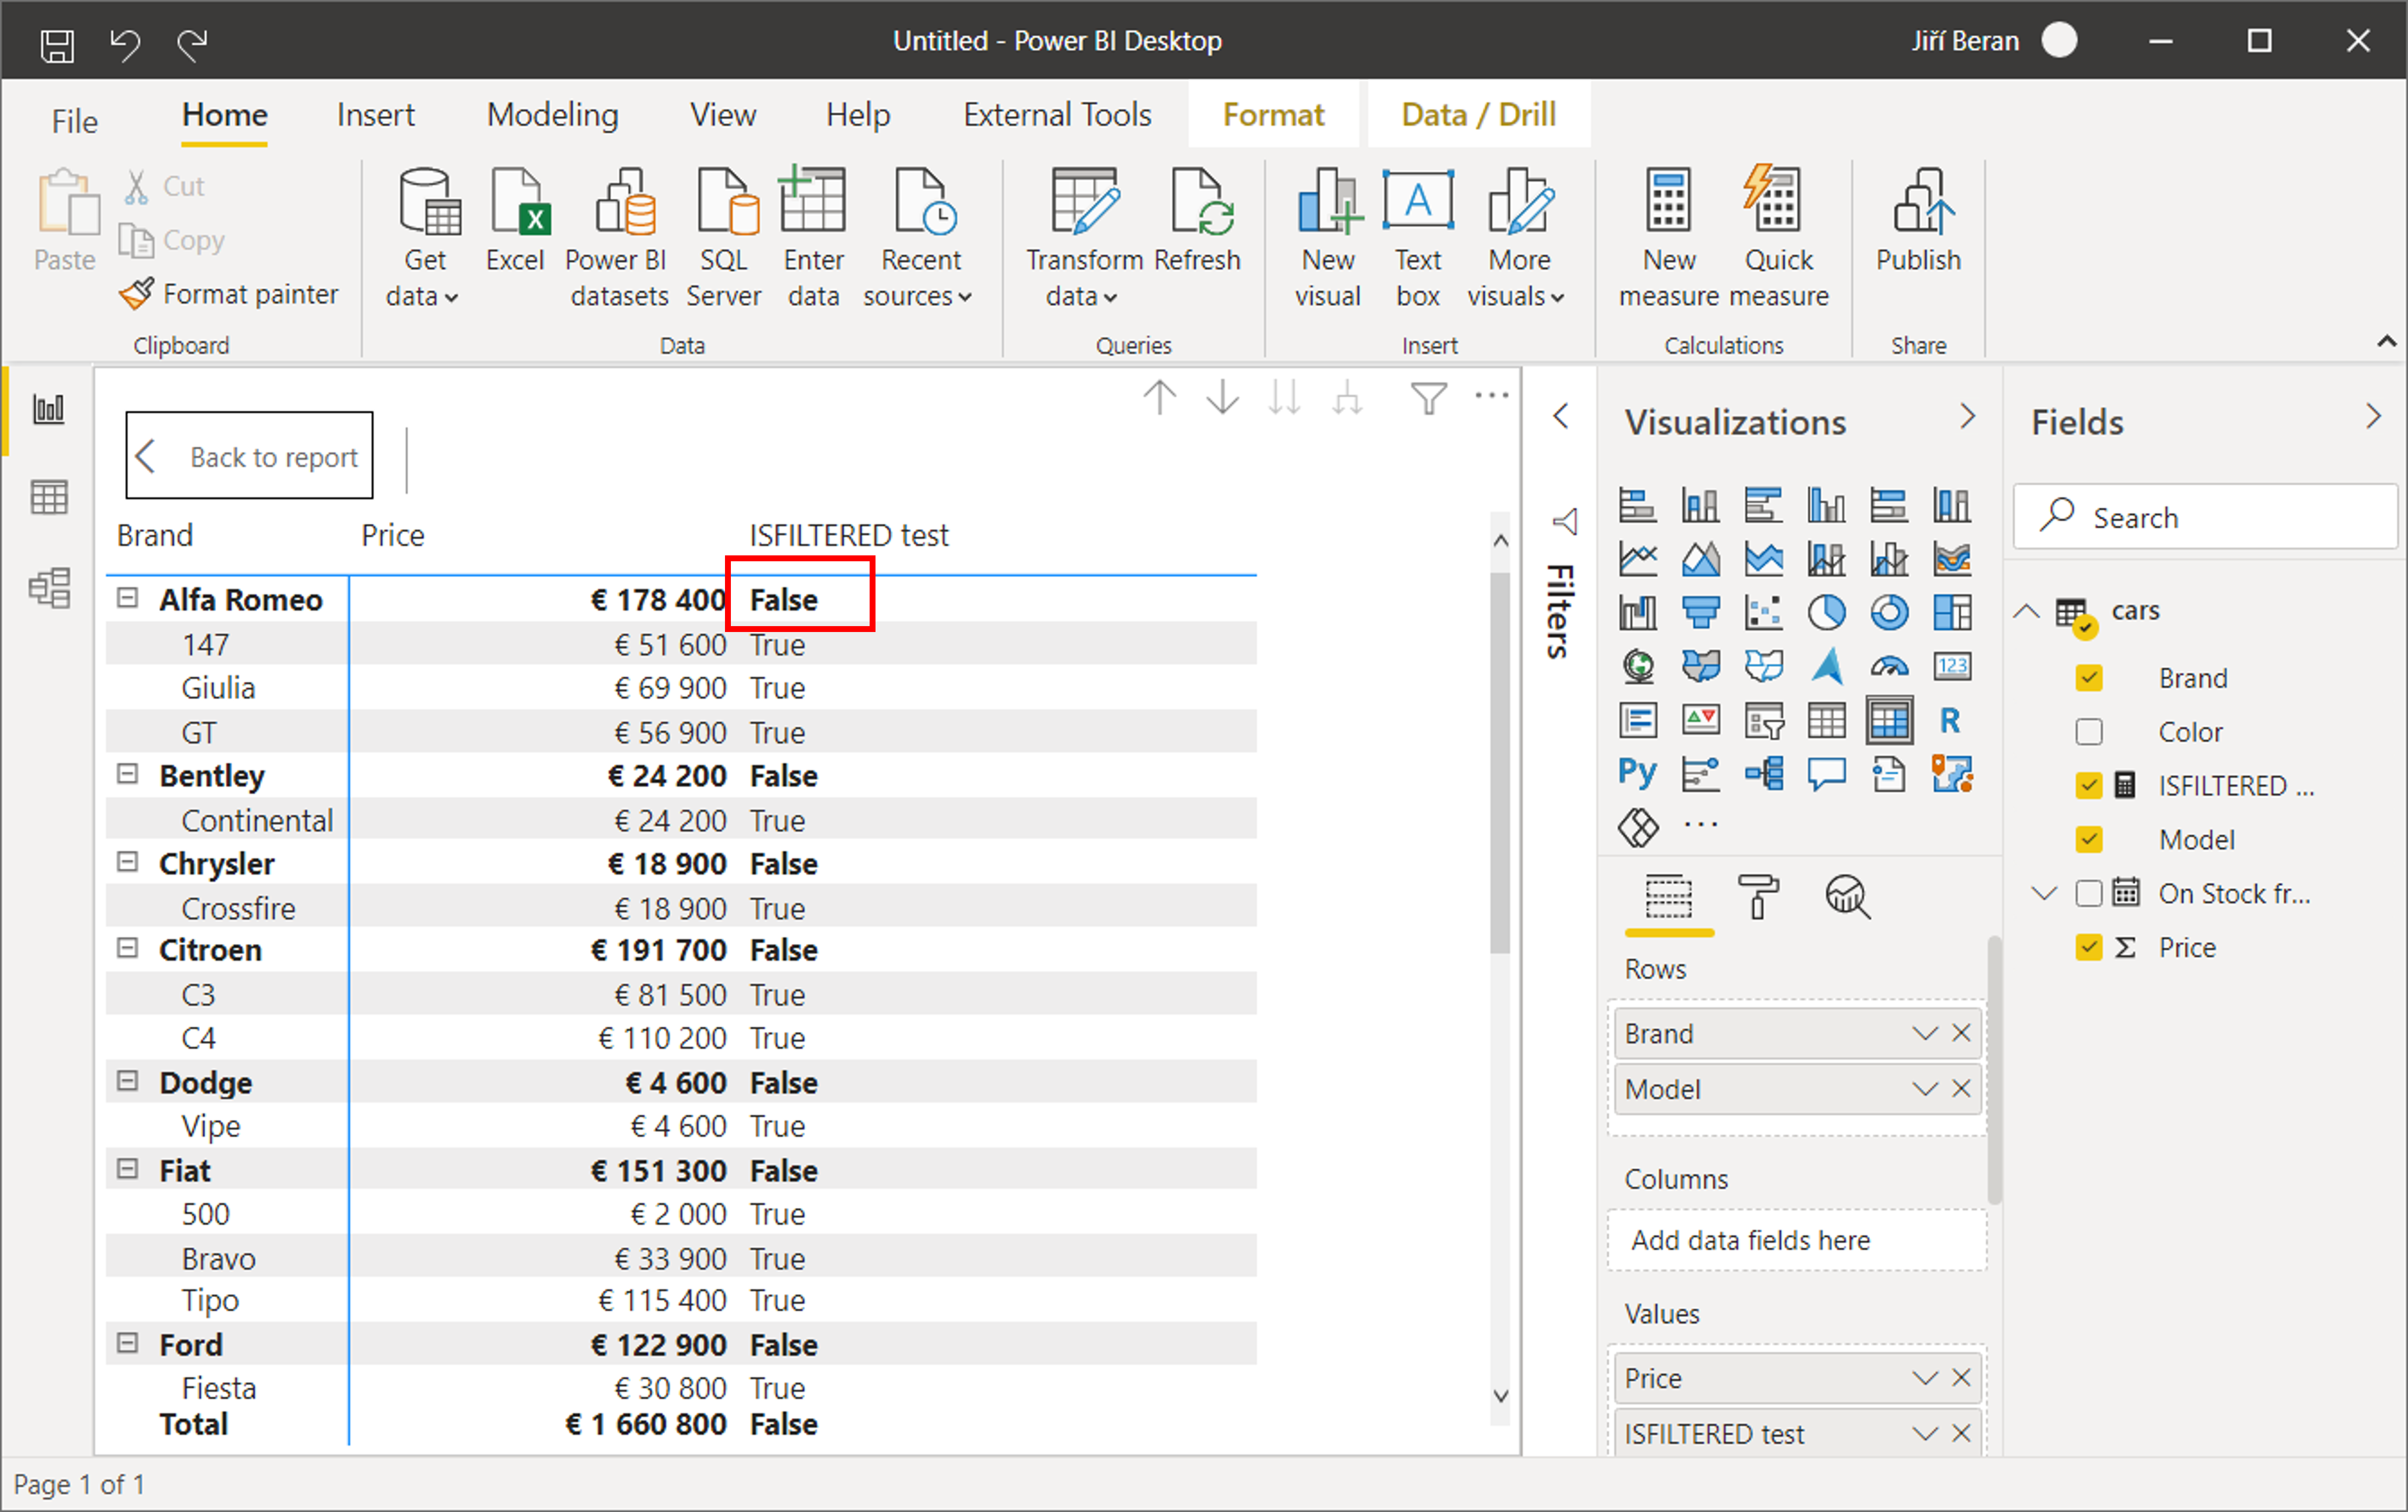
To see it clearly – if we used the ISFILTERED function itself, the result would be like this:
![]()
![]()
Pište kdykoliv. Odpovíme do 24h
![]()
© exceltown.com / 2006 - 2023 Vyrobilo studio bARTvisions s.r.o.