Našimi kurzy prošlo více než 10 000+ účastníků
2 392 ověřených referencí účastníků našich kurzů. Přesvědčte se sami
This is about the SUMMARIZECOLUMNS function. It groups values in a table, similarly to older SUMMARIZE. (More about it here.)
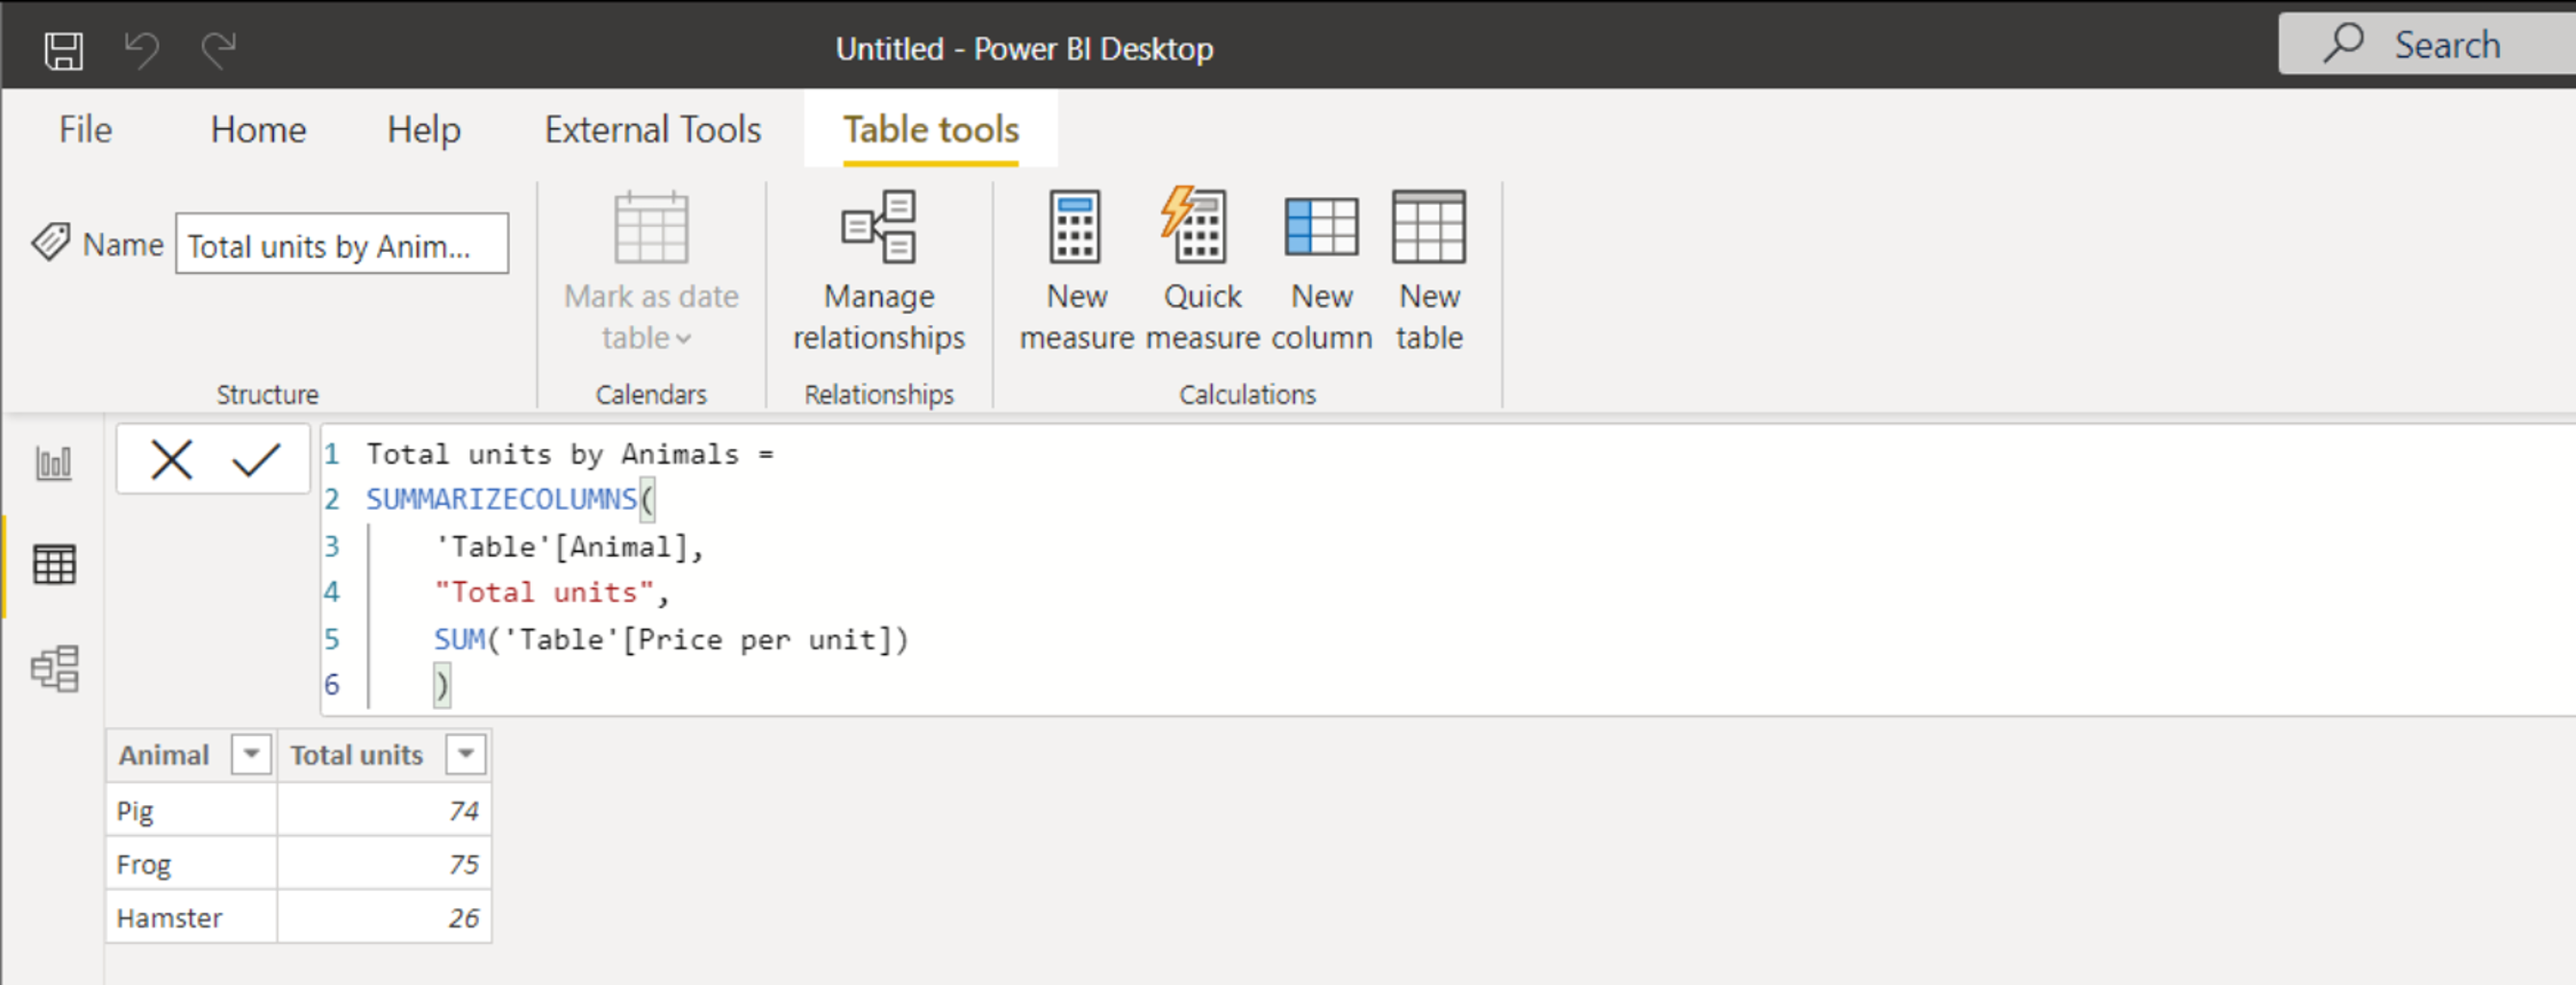
Simple example. In this table we are going to group by Animals and summarize total numbers of units.

Let´s do it with this syntax:
There are these arguments – column used for grouping, name of new calculated group and calculation used to create it.
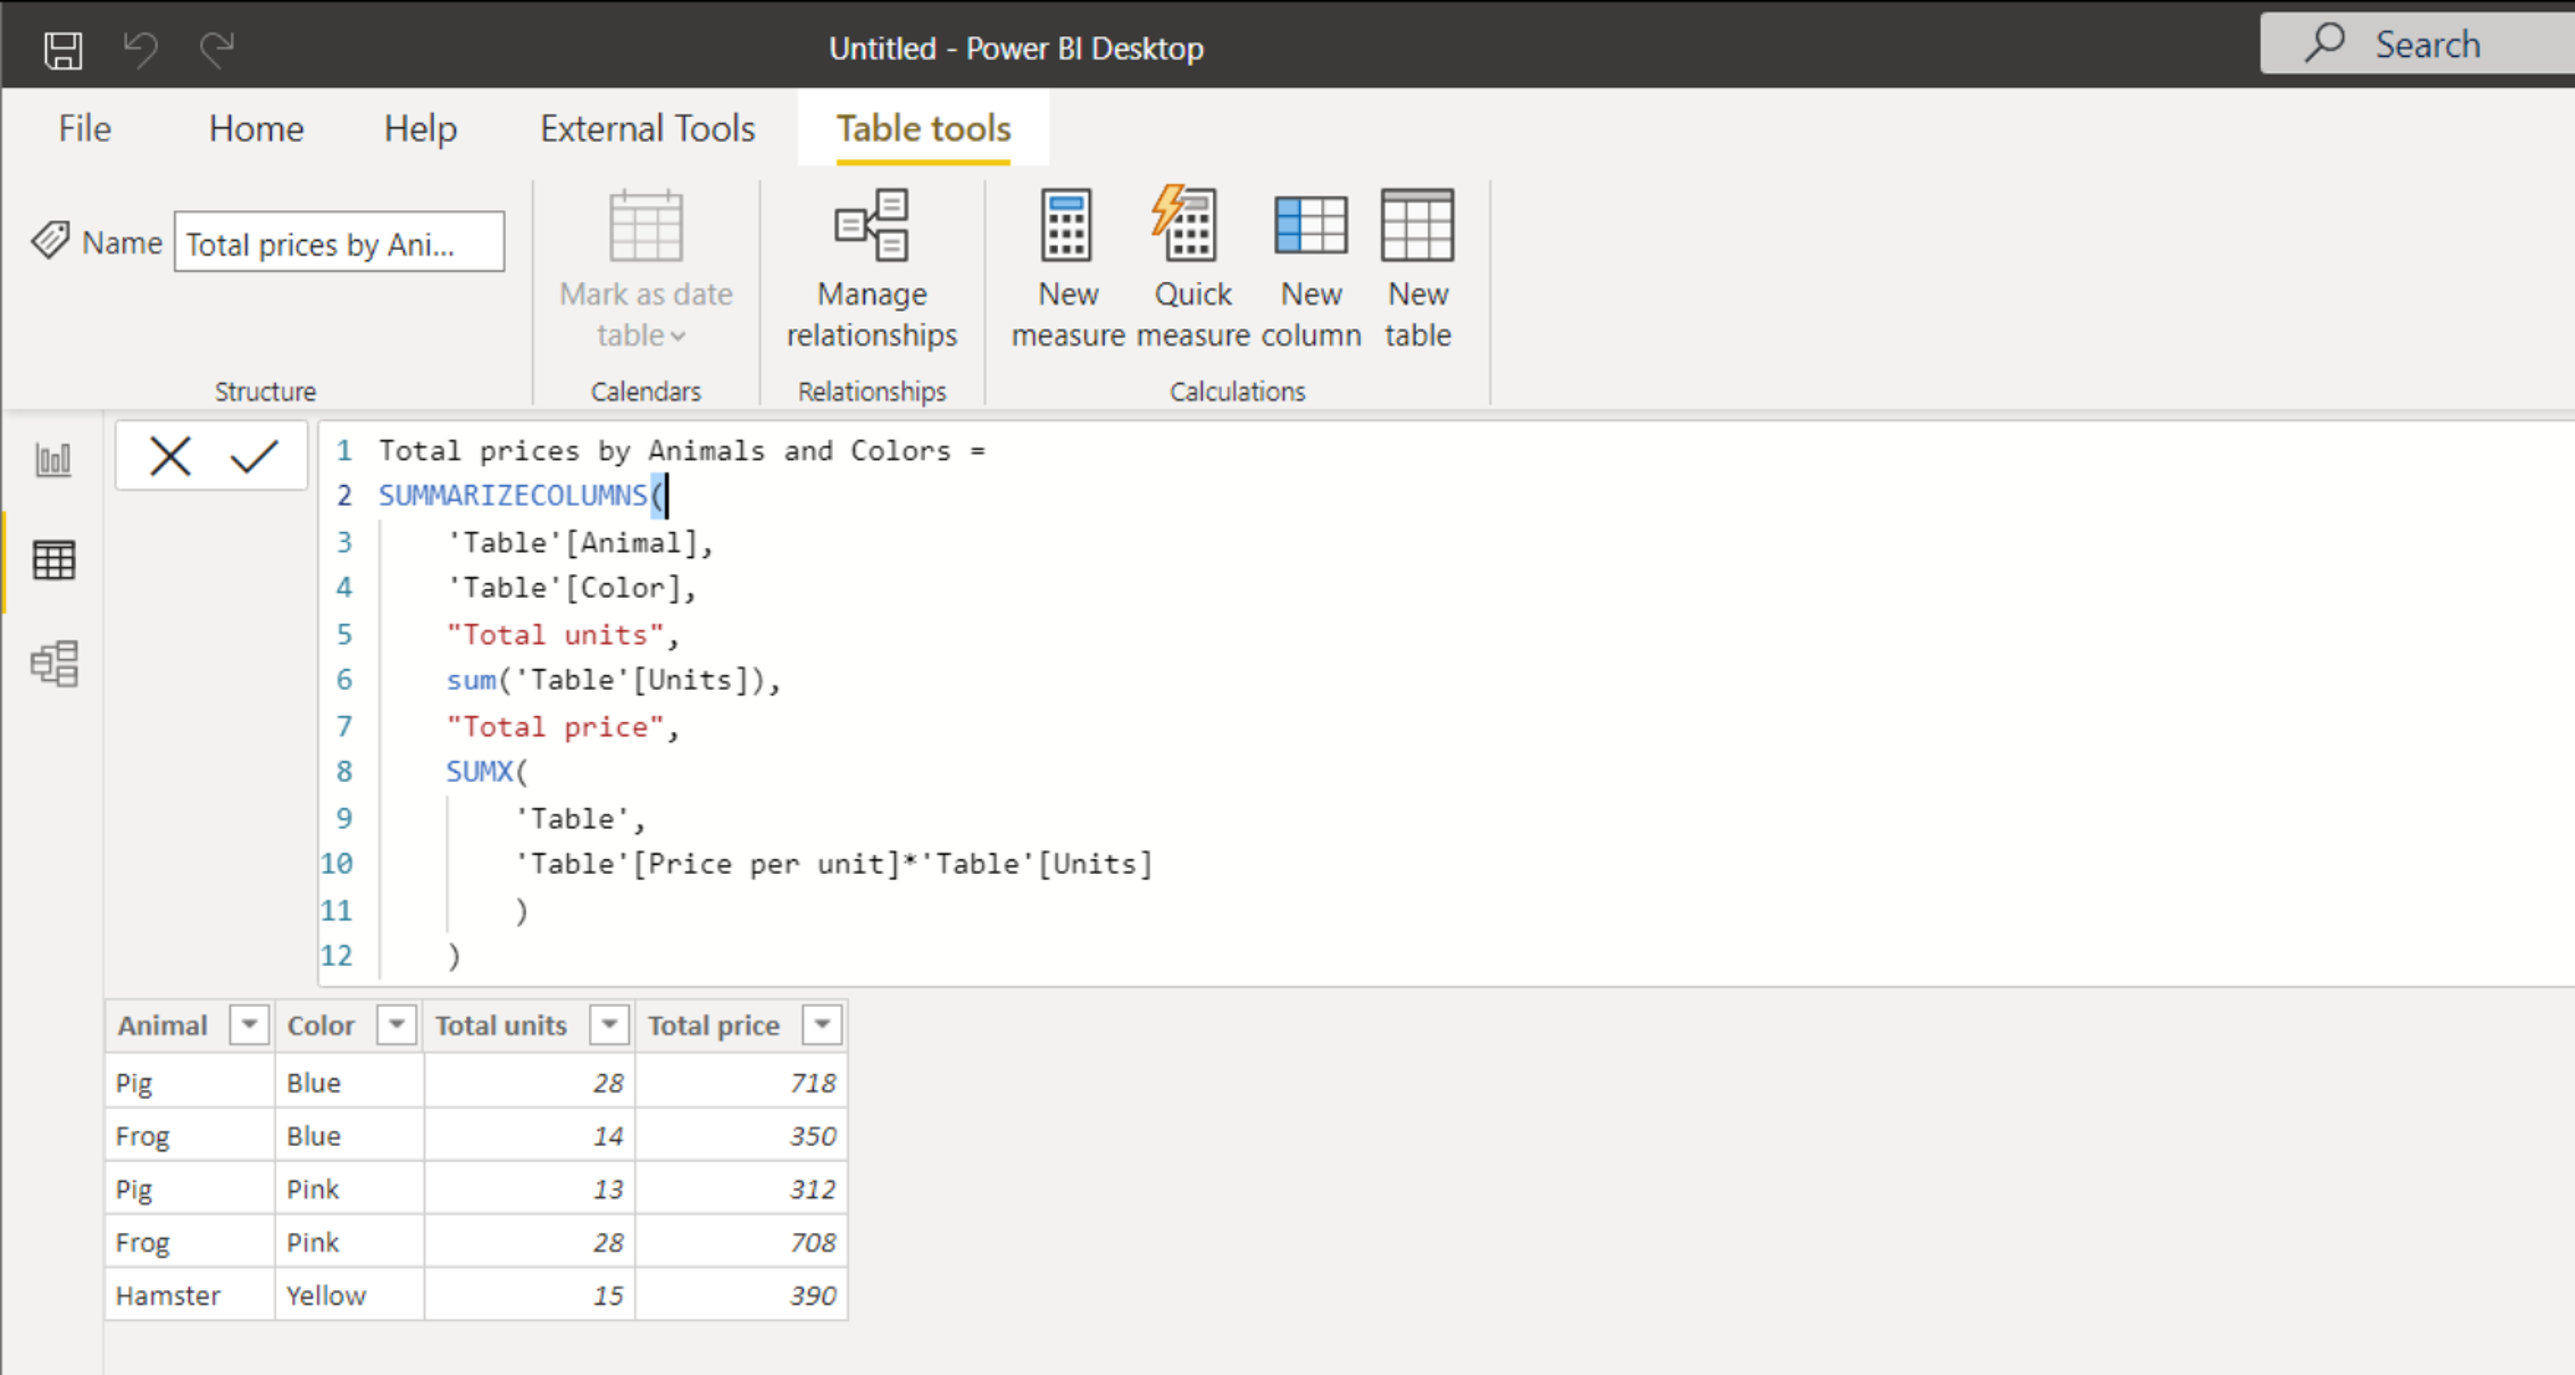
This is an example of more complex syntax – with two grouping columns and two calculated columns, using for example SUMX function.
Now there are two grouping columns, two name columns and two calculated columns.
![]()
![]()
Pište kdykoliv. Odpovíme do 24h
![]()
© exceltown.com / 2006 - 2023 Vyrobilo studio bARTvisions s.r.o.