Našimi kurzy prošlo více než 10 000+ účastníků
2 392 ověřených referencí účastníků našich kurzů. Přesvědčte se sami
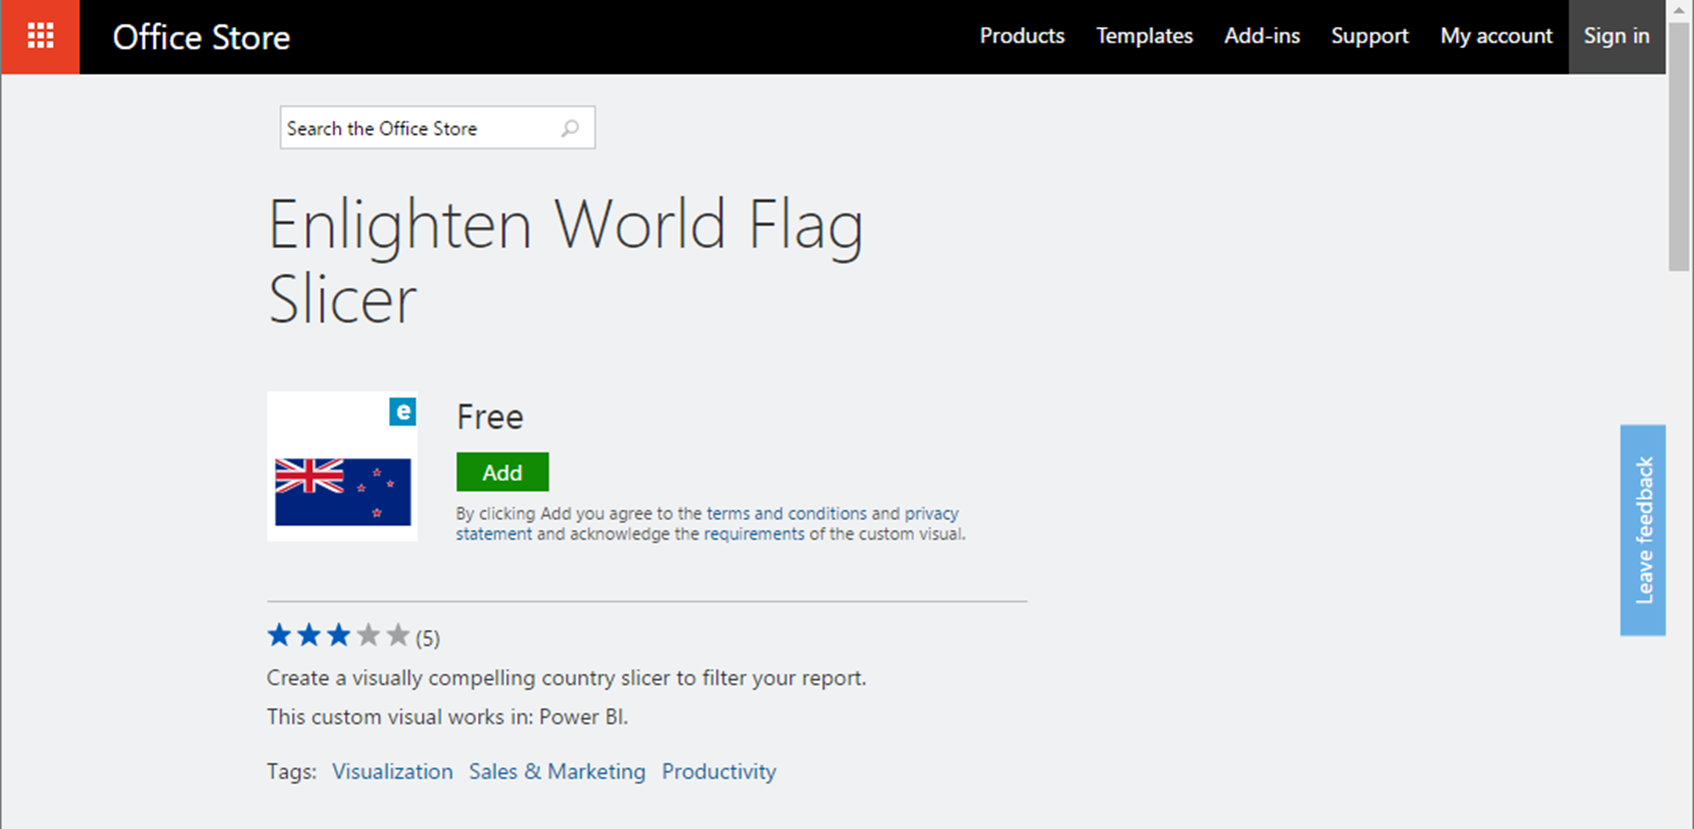
This manual describes how to use custom visuals (charts) that are not included in default Power BI Desktop.
You can download them from this site. Select the one you need and download it with “Add”.
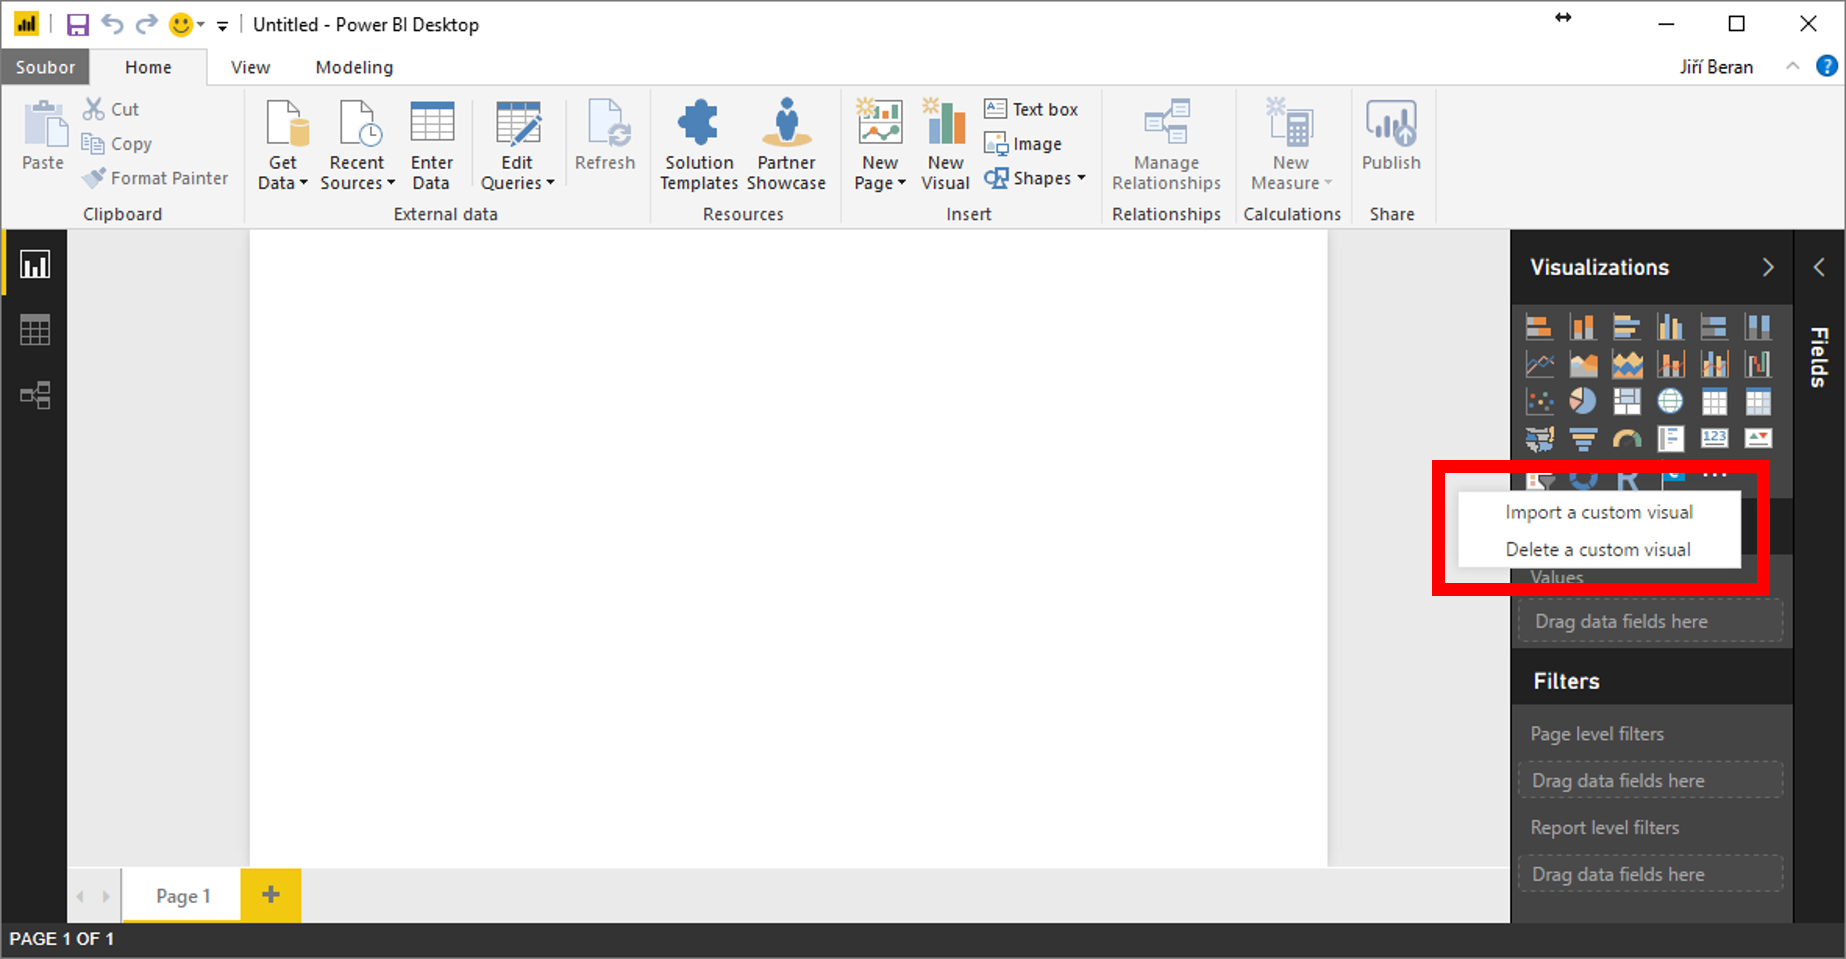
 Add this visual in Designer:
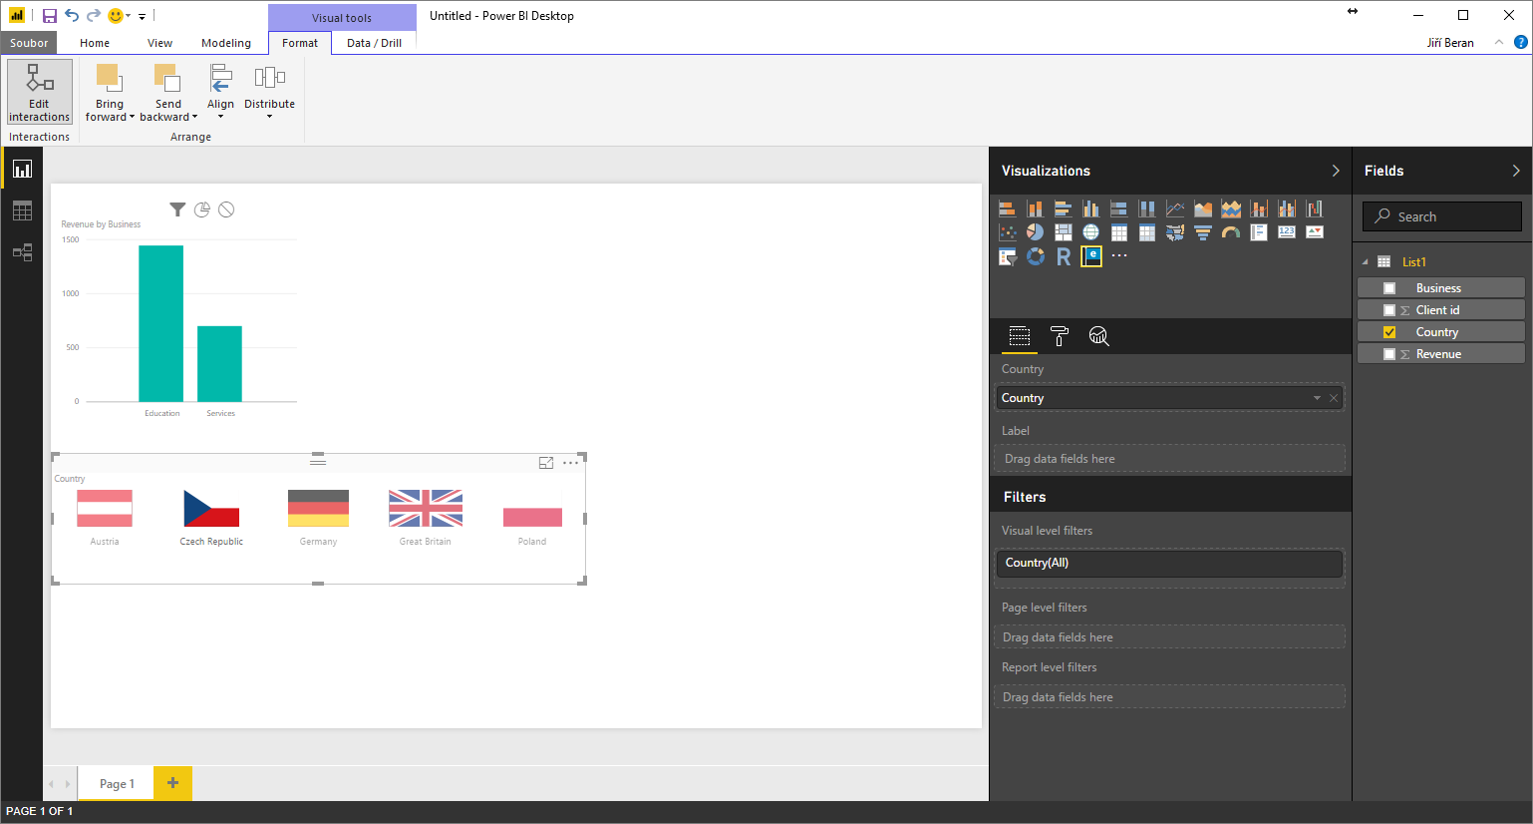
 And then just make charts… For example Enlighten World Flag Slicer visual enables you to make filtering buttons with flag images automatically assigned to names of countries.
![]()
![]()
Pište kdykoliv. Odpovíme do 24h
![]()
© exceltown.com / 2006 - 2023 Vyrobilo studio bARTvisions s.r.o.