Našimi kurzy prošlo více než 10 000+ účastníků
2 392 ověřených referencí účastníků našich kurzů. Přesvědčte se sami
This article describes a situation where you want to attribute something to the displayed values – such as a brief comment.
In Excel, it’s trivial. You just click in the next cell and type. But Power BI works with data a little differently and it simply doesn’t work that way.
Still, it´s possible, you just need a table for storing comments (in our example Dataverse, otherwise Excel, Google Docs, whatever …) and Power Apps.
The whole thing is that Power App writes the data into a database, from it is loaded to Power Bi and connected with data to comment. It looks like this:
How to do it?
It can be anywhere.
If it is a technology that allows Direct Query connection (SQL server, Access, in our case Dataverse), it will be possible to display comments without refreshing other content. Otherwise, feel free to use Excel, Google Docs…

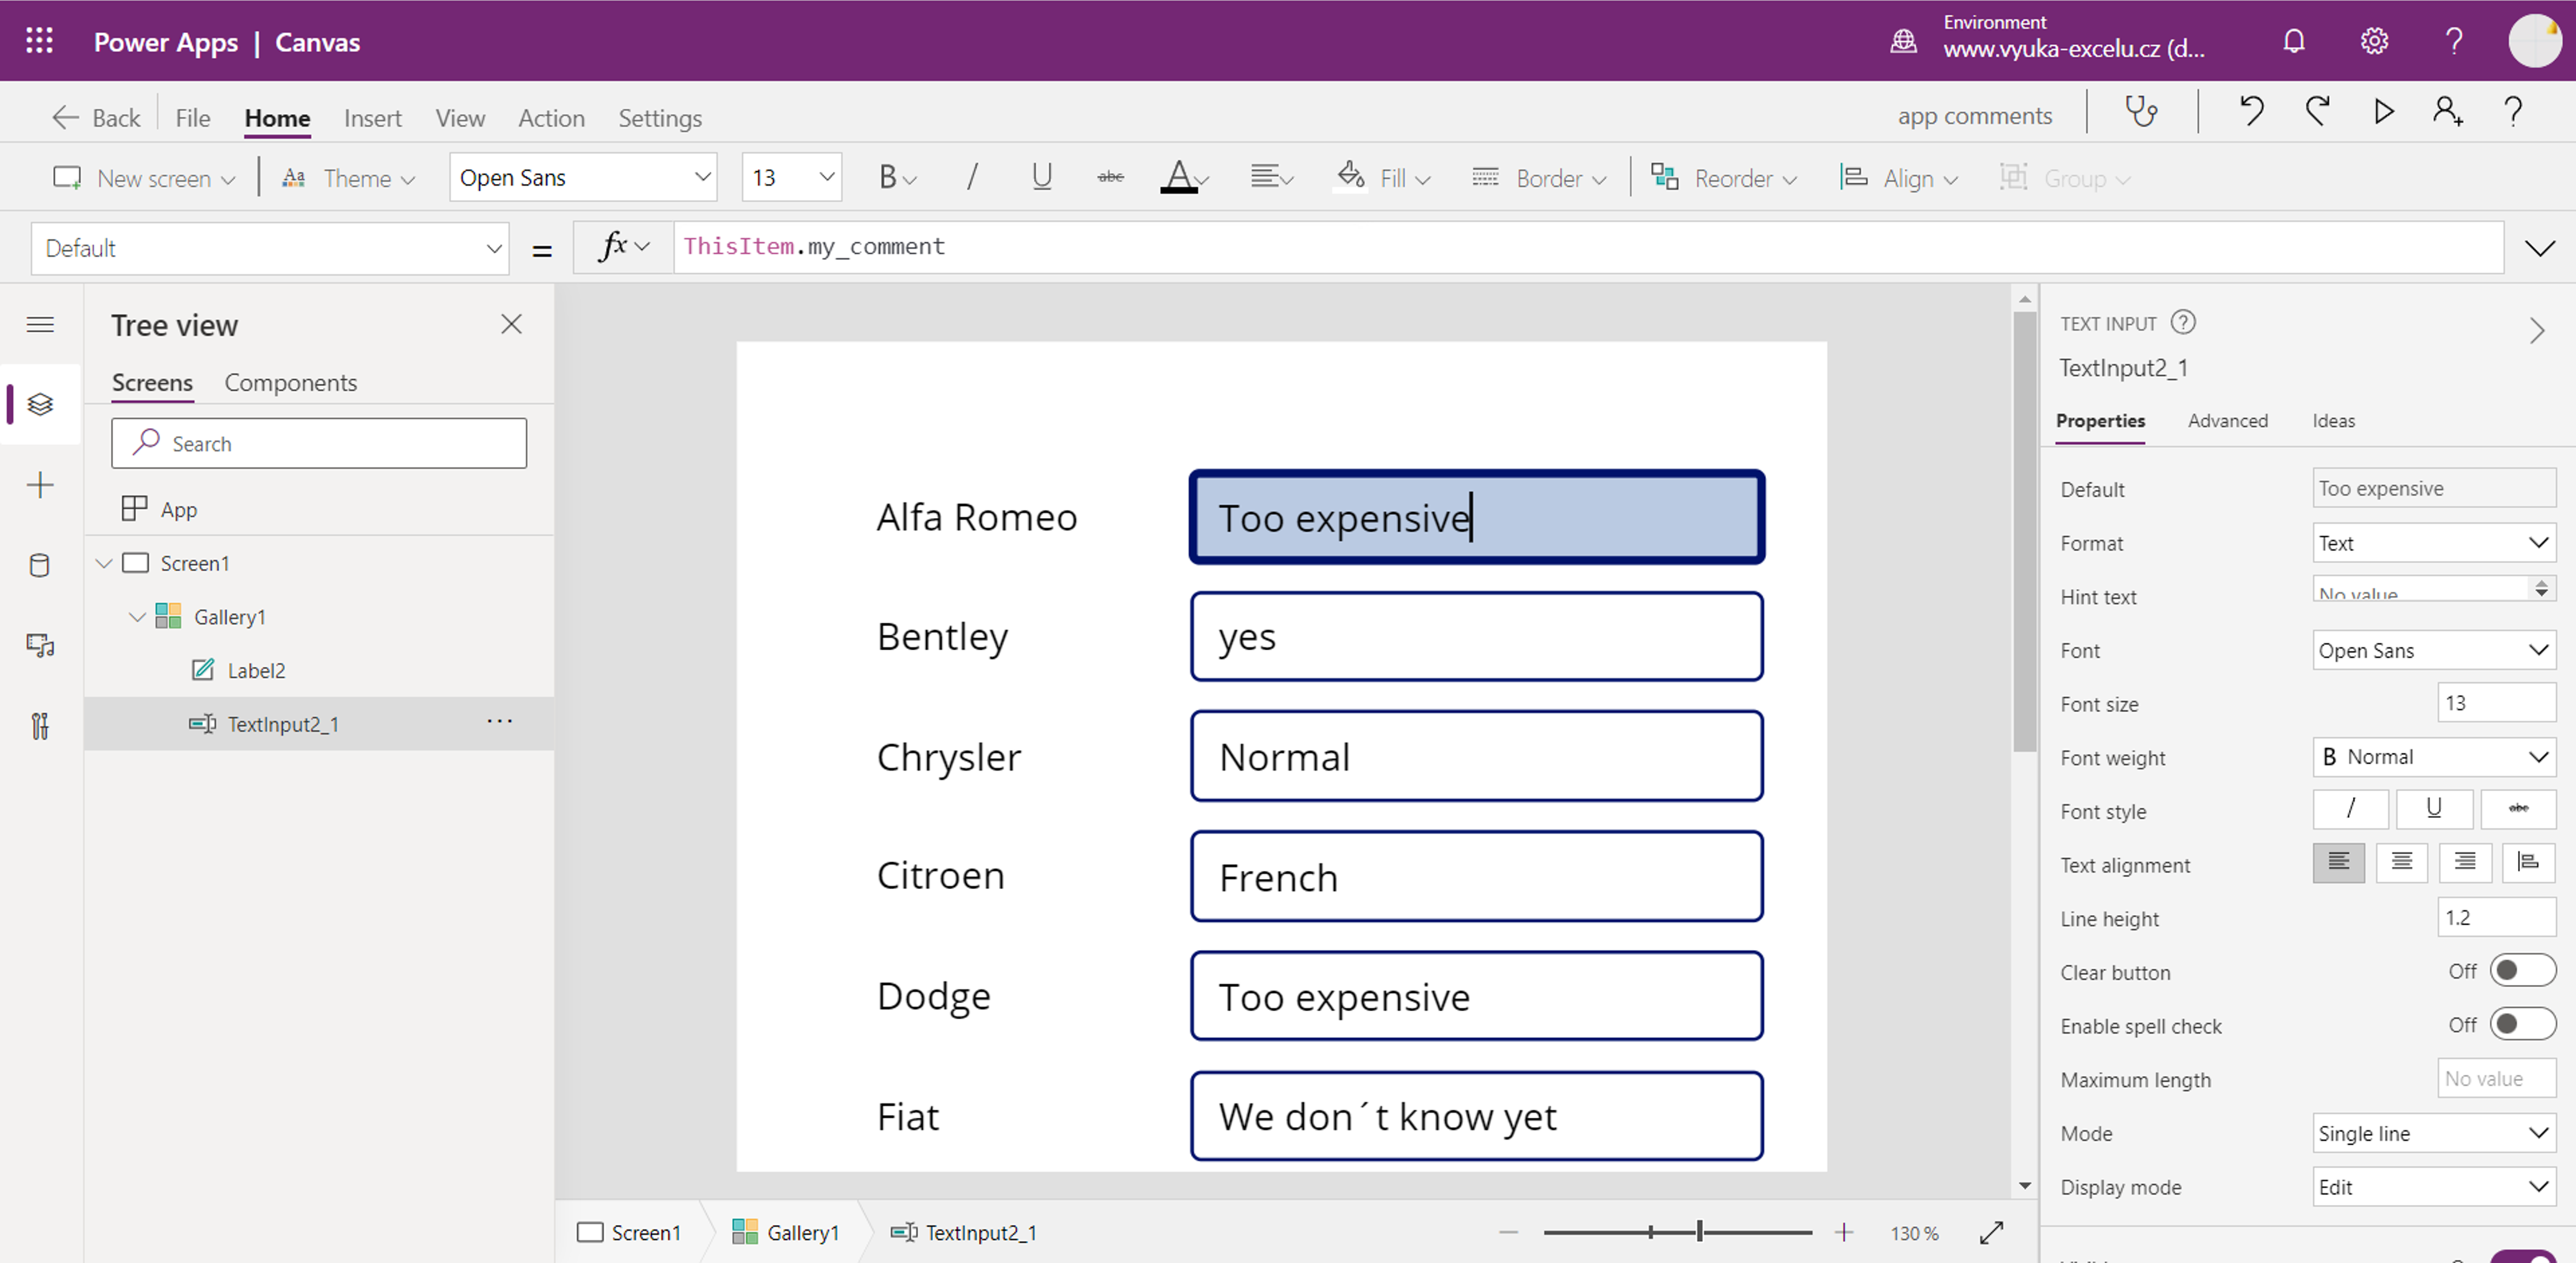
Use this table to create a Power App – just a simple gallery editing data is OK.

Connect to the table with comments:
Use Direct Query, if possible:
Connect it with original content (possibly using relationship):
Create a visual displaying values from original table and comments, and visual with previously created Power App.
When comments are overwritten in the app, they are overwritten in both the comment table and the visual. If we want, we can set automatic refresh of the page (more about real-time displaying data here).
2 392 ověřených referencí účastníků našich kurzů. Přesvědčte se sami
![]()
![]()
Pište kdykoliv. Odpovíme do 24h
© exceltown.com / 2006 - 2023 Vyrobilo studio bARTvisions s.r.o.