Našimi kurzy prošlo více než 10 000+ účastníků
2 392 ověřených referencí účastníků našich kurzů. Přesvědčte se sami
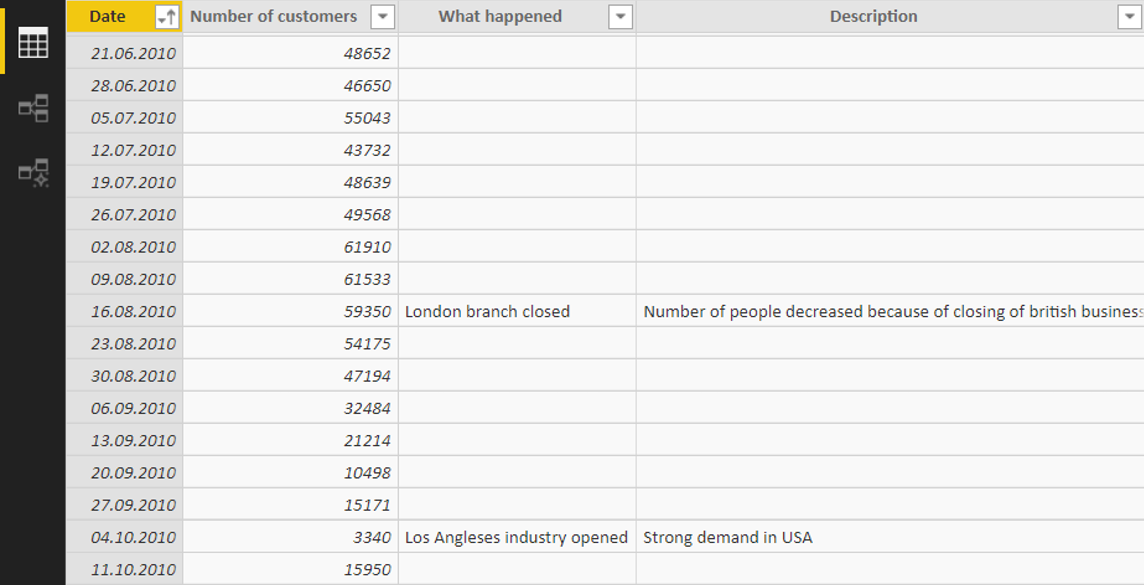
Pulse chart is a custom visual, presenting a tie series and at the same time showing what happened in time.
It looks like this:
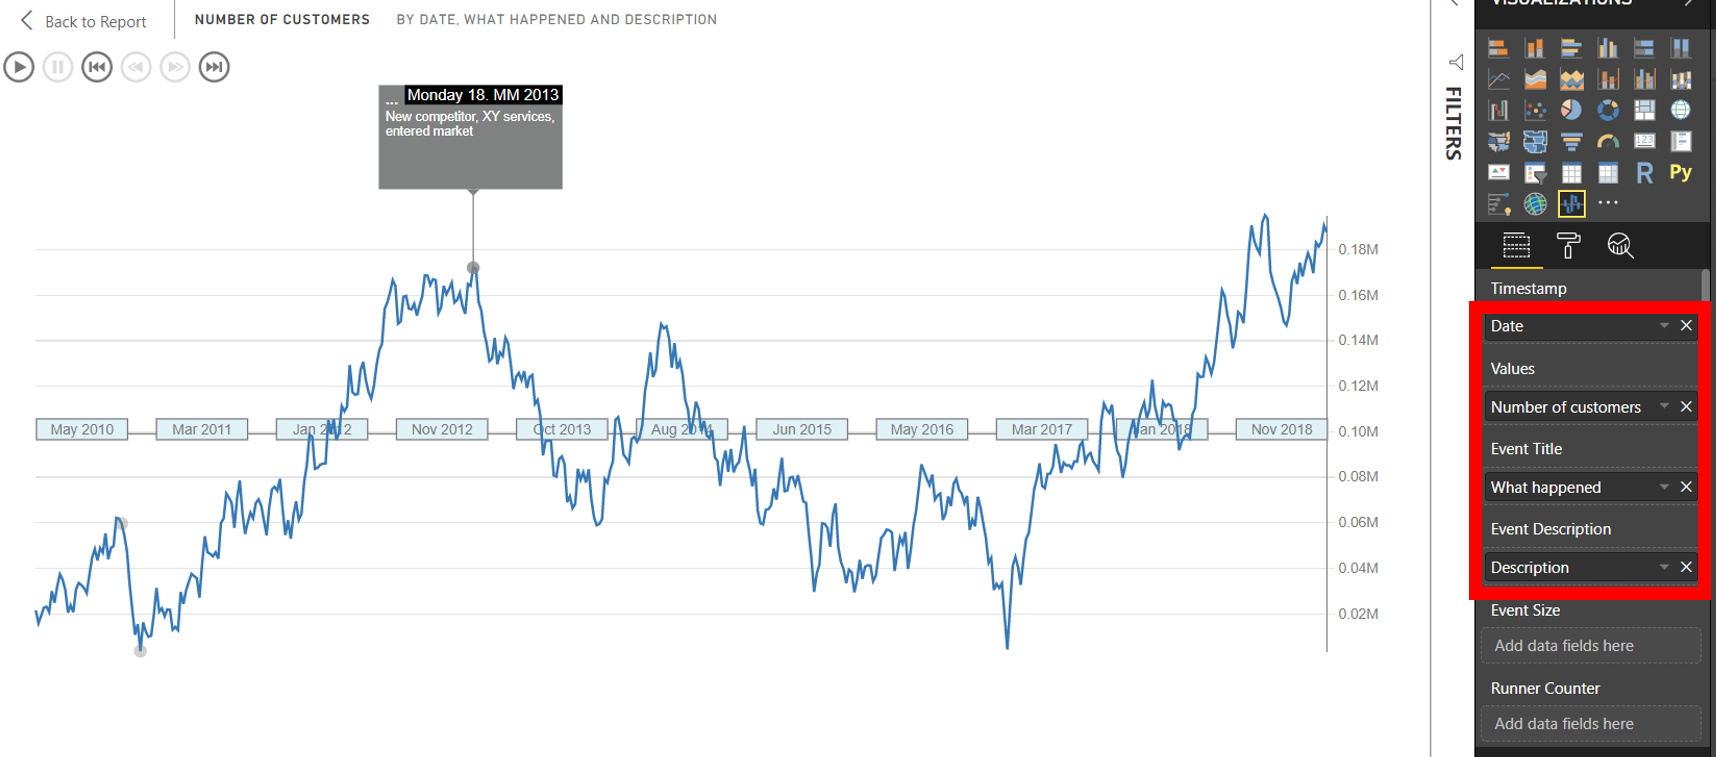
What do we need?
What do the button on the left side mean?
![]() Runs the chart from left to right
Runs the chart from left to right
![]() Stops it
Stops it
![]() Goes to the start
Goes to the start
![]() Moves to the previous event
Moves to the previous event
![]() Goes to the next event
Goes to the next event
![]() Goes to the end
Goes to the end
![]()
![]()
Pište kdykoliv. Odpovíme do 24h
![]()
© exceltown.com / 2006 - 2023 Vyrobilo studio bARTvisions s.r.o.