Našimi kurzy prošlo více než 10 000+ účastníků
2 392 ověřených referencí účastníků našich kurzů. Přesvědčte se sami
This article describes, how to change the values shown in a chart with one click.
For example here you can simply switch between pieces and total prices.
How to do it?
First you need a table containing values corresponding to values show in slicer. You can import the table or create it using DAX and DATATABLE function.
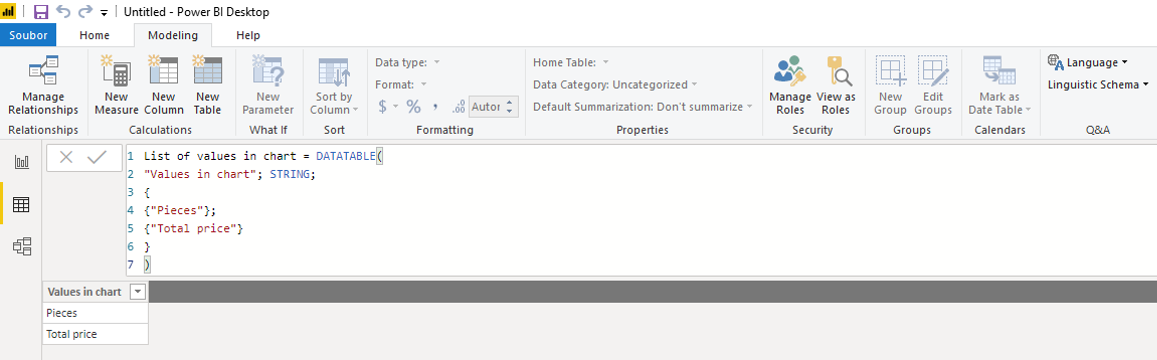
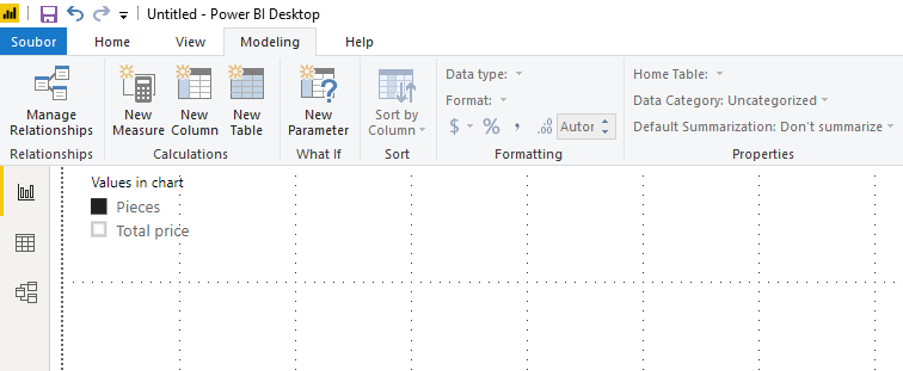
Let´s create a slicer, that uses this table.
Now create a measure, “switchable” by item selected in slicer.
Use this measure in visual.
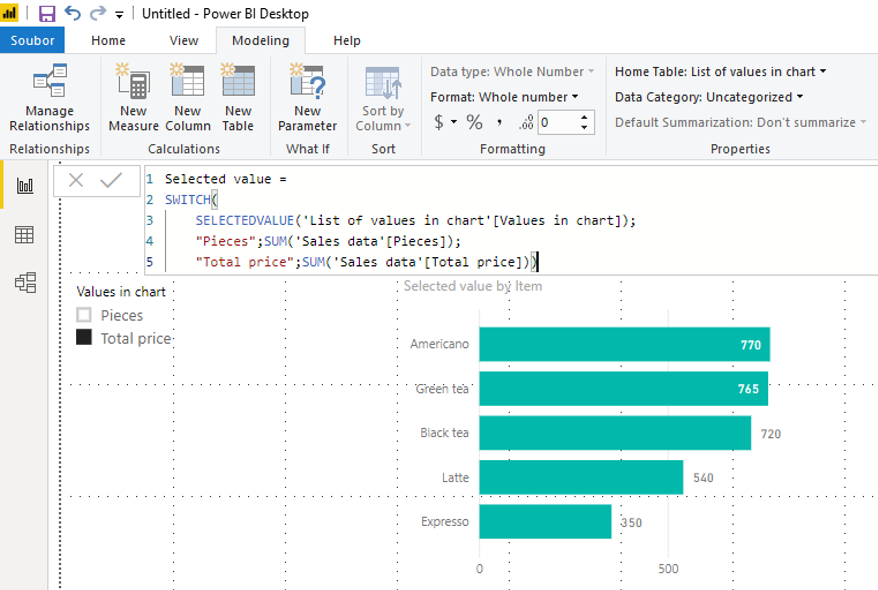
Now the item selected in slicer is “recognized” by SELECTEDVALUE and, depending on its value, returns one of multiple calculations.
![]()
![]()
Pište kdykoliv. Odpovíme do 24h
![]()
© exceltown.com / 2006 - 2023 Vyrobilo studio bARTvisions s.r.o.