Našimi kurzy prošlo více než 10 000+ účastníků
2 392 ověřených referencí účastníků našich kurzů. Přesvědčte se sami
Let´s have visualisation like this, showing numbers of cars by Brand:
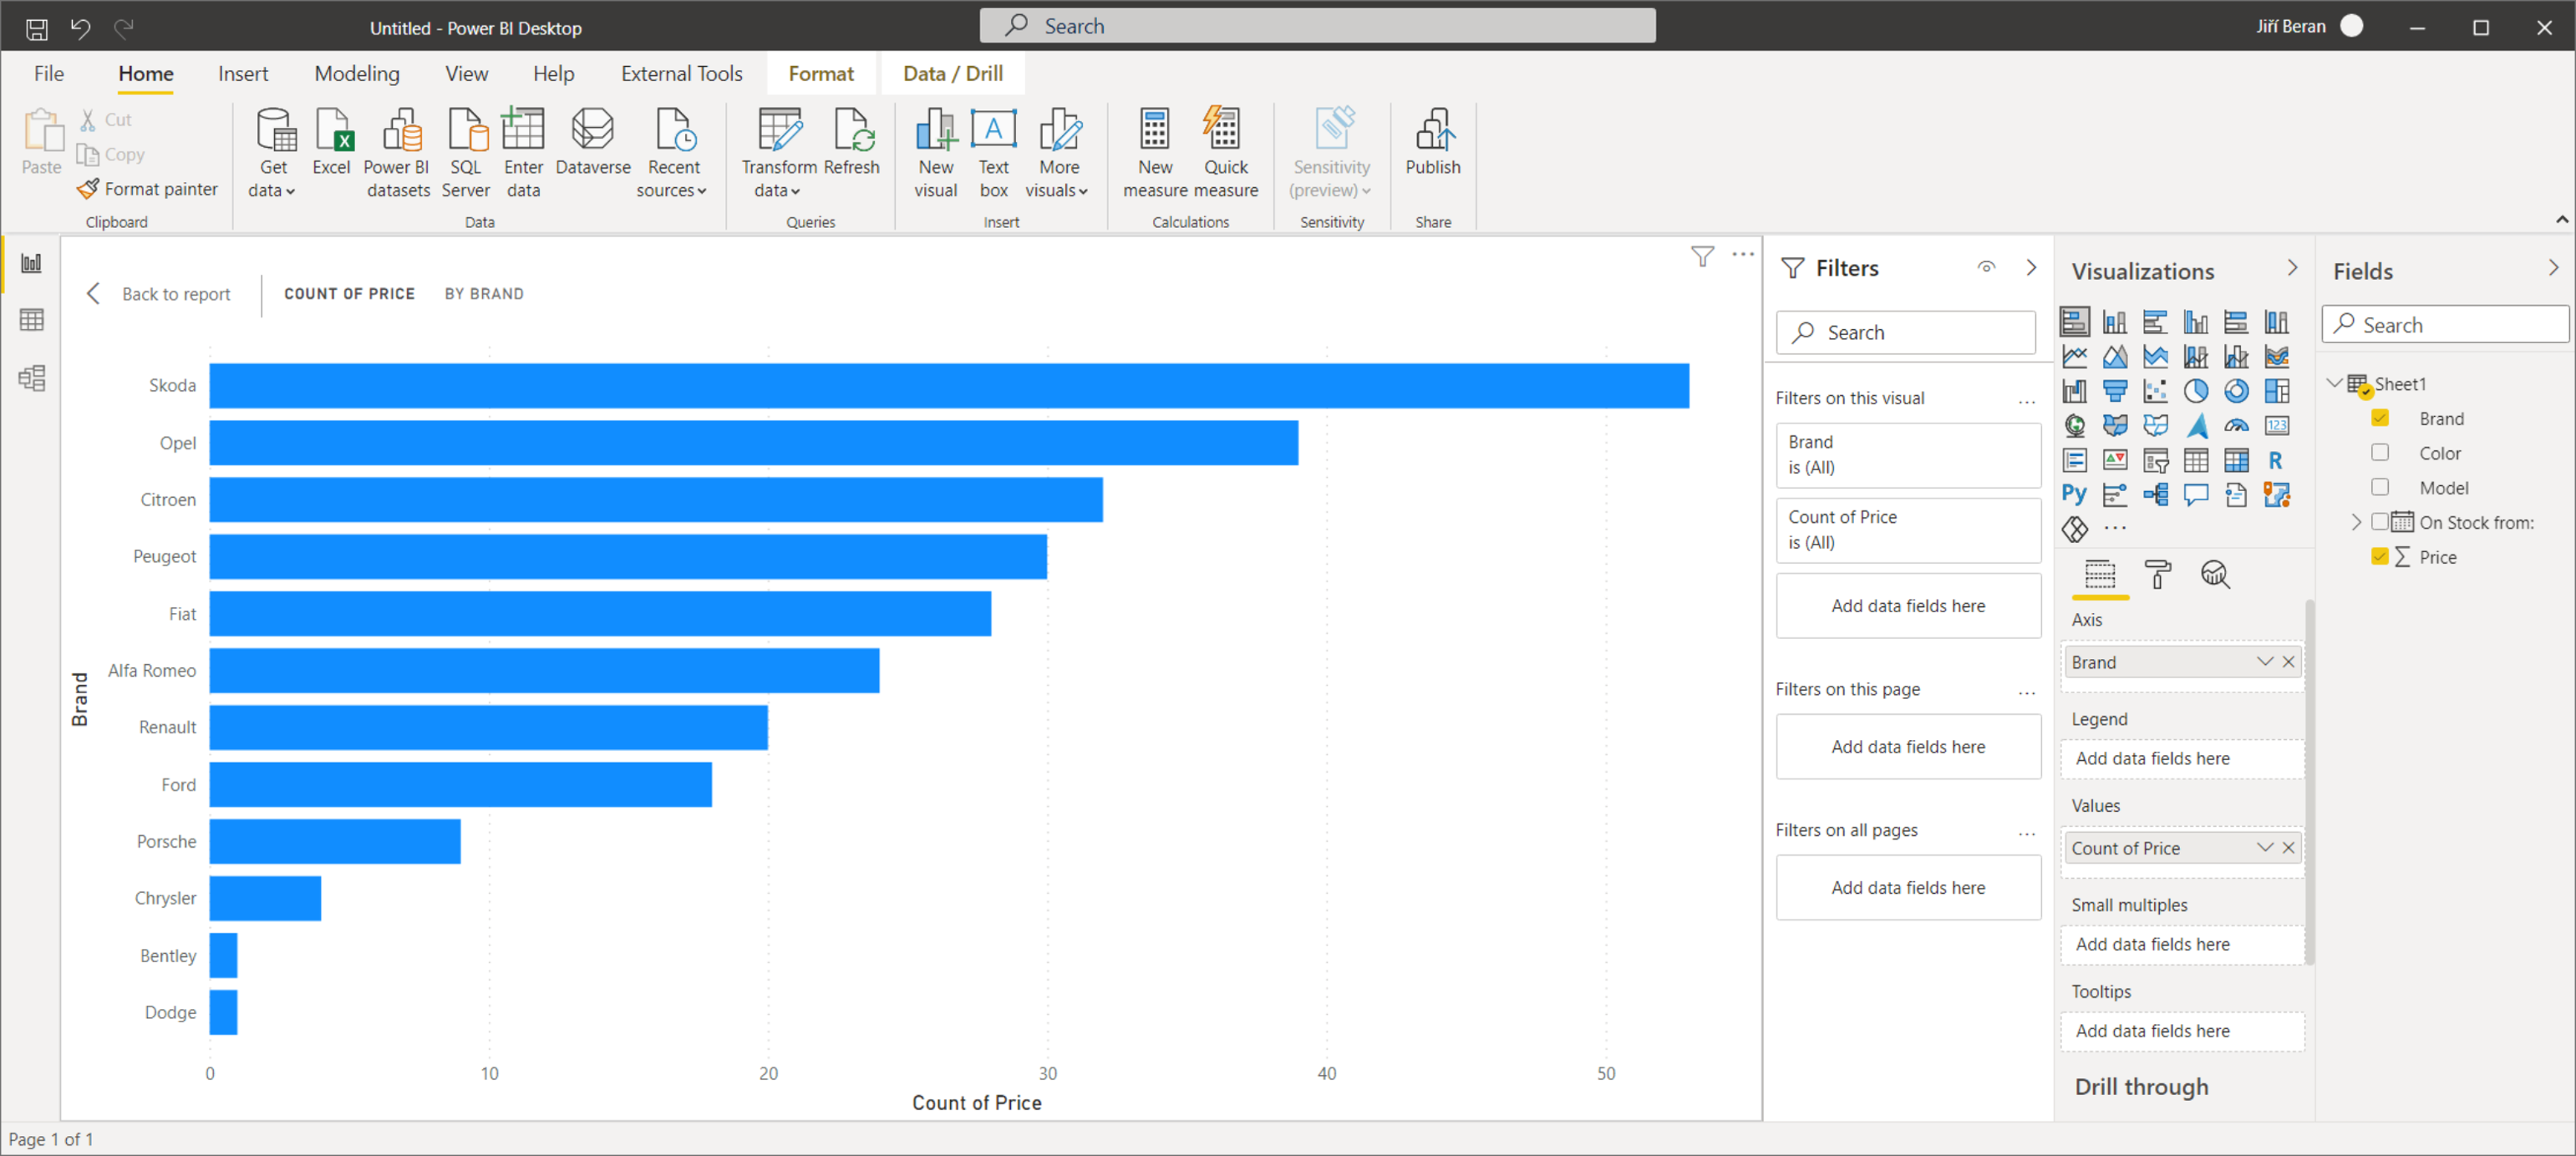
Unfortunately, there are too many items, so we need to keep only, let´s say, five biggest brands.
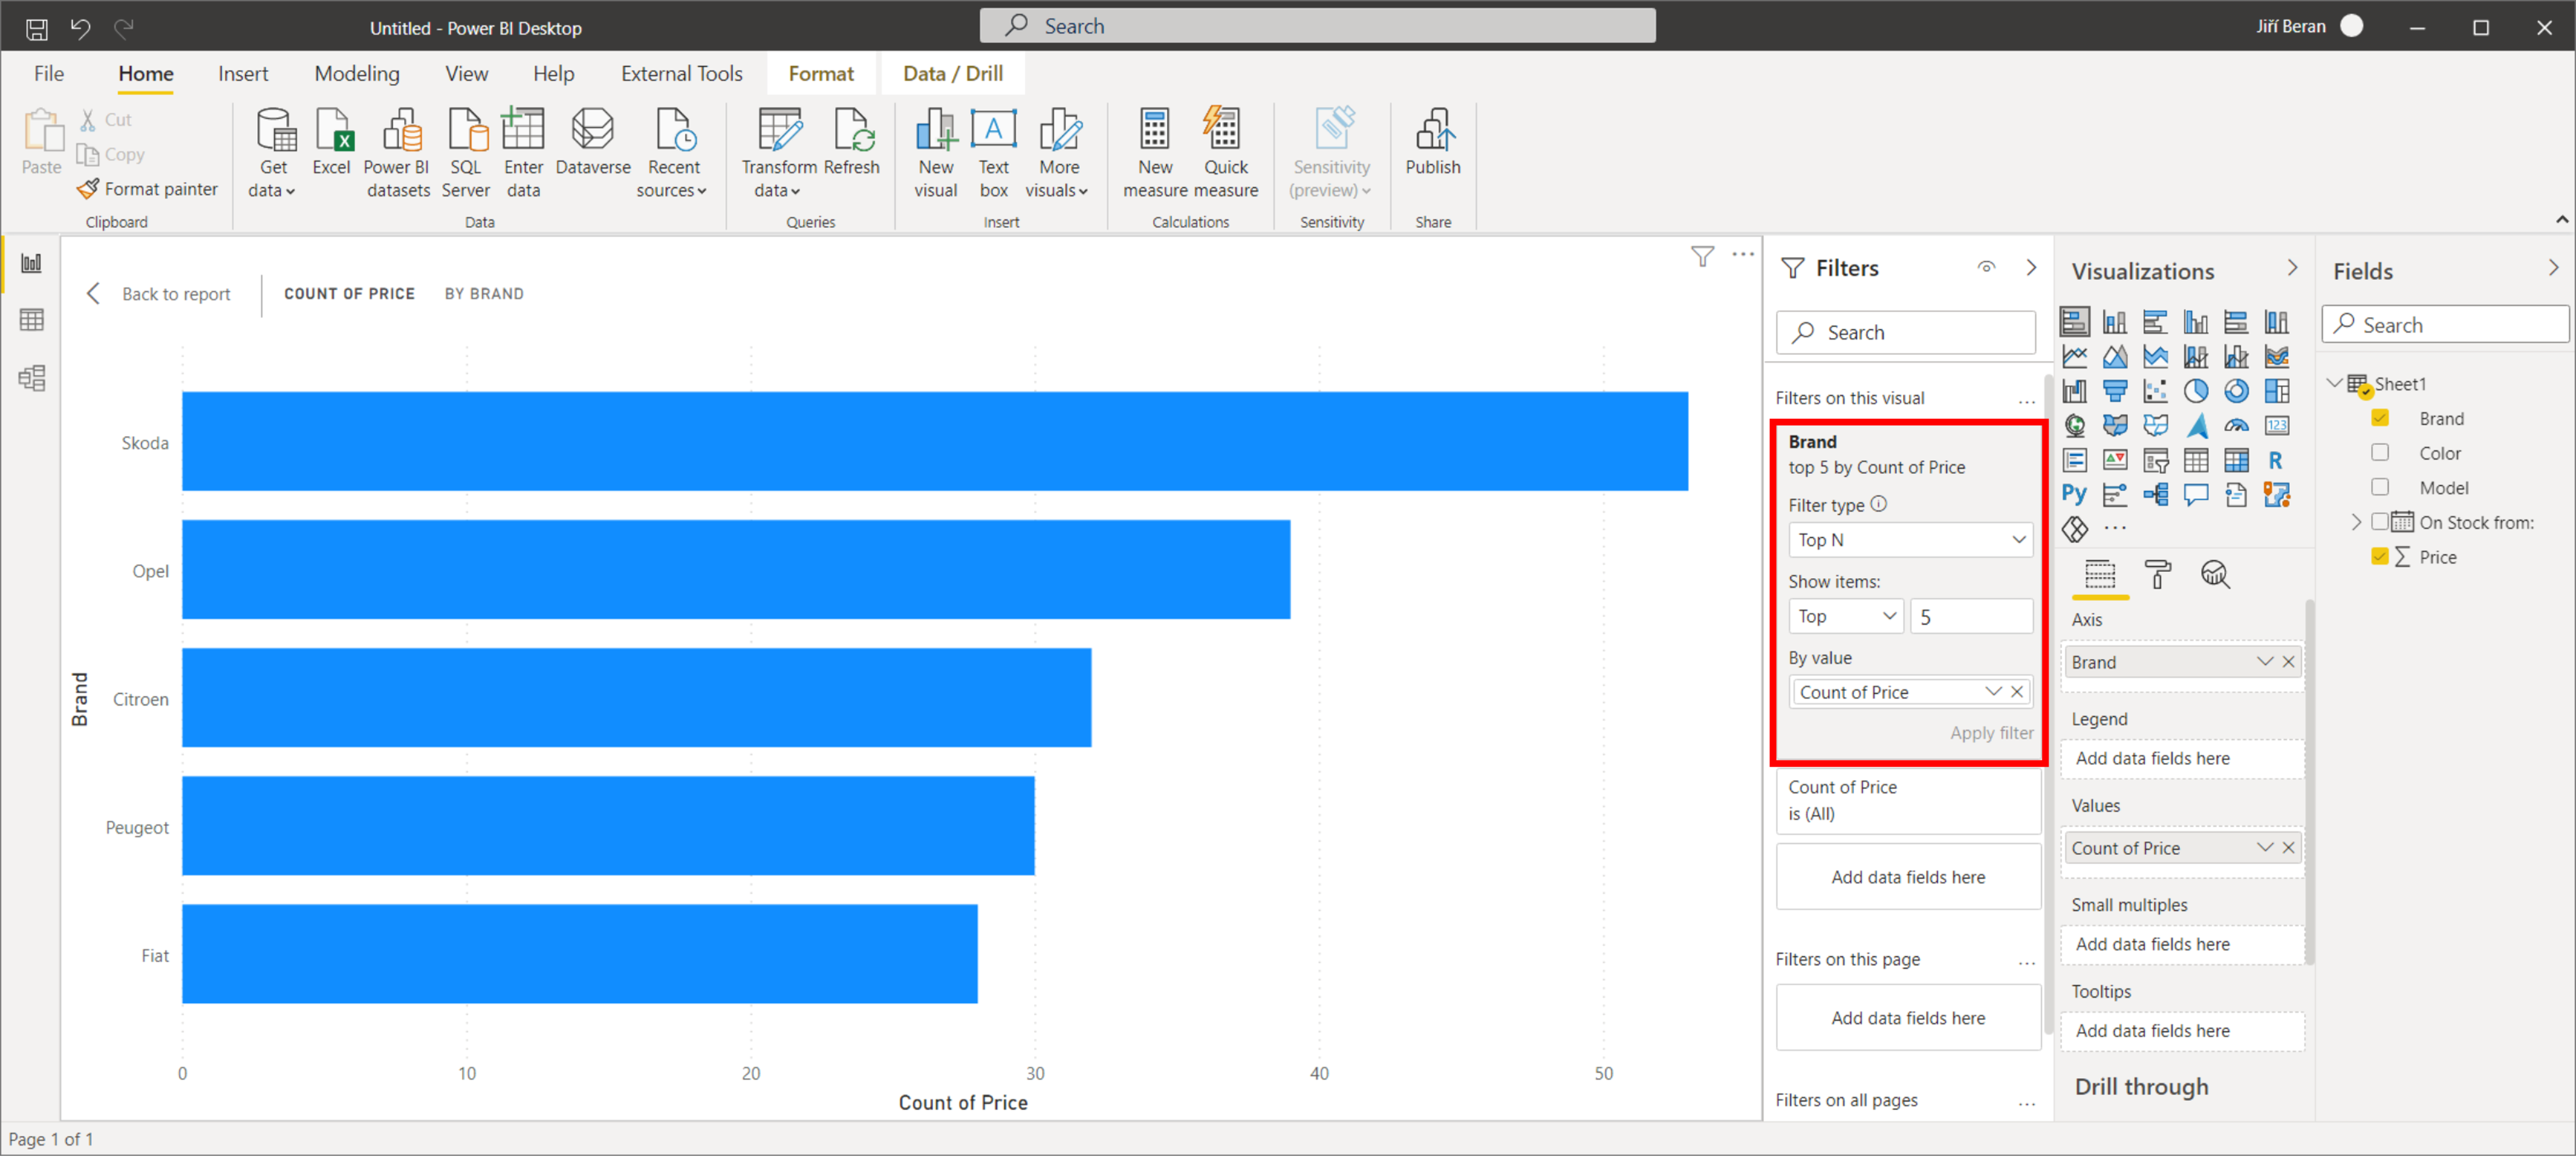
Let´s use filter (on the visual level, page level all report level).
Set the filter type to “Top N” and five biggest.
Then define, on which value are the top values based. This can be the same as the value in visual, but it can be also something else.
Small note – to get top N items in DAX table creation (not in a visual), you may appreciate the TOPN DAX function.
![]()
![]()
Pište kdykoliv. Odpovíme do 24h
![]()
© exceltown.com / 2006 - 2023 Vyrobilo studio bARTvisions s.r.o.