Našimi kurzy prošlo více než 10 000+ účastníků
2 392 ověřených referencí účastníků našich kurzů. Přesvědčte se sami
This article is about SUMMARIZE function, which groups rows in data models. It¨s little similar to Pivot Tables in common Excel or to groupping in Power Query (Get and Transform). The result of SUMMARIZE is always a table. Which means it can be used in new table in data models, or, in combination with other function, for new measure or new column creation – so as it results in one number.
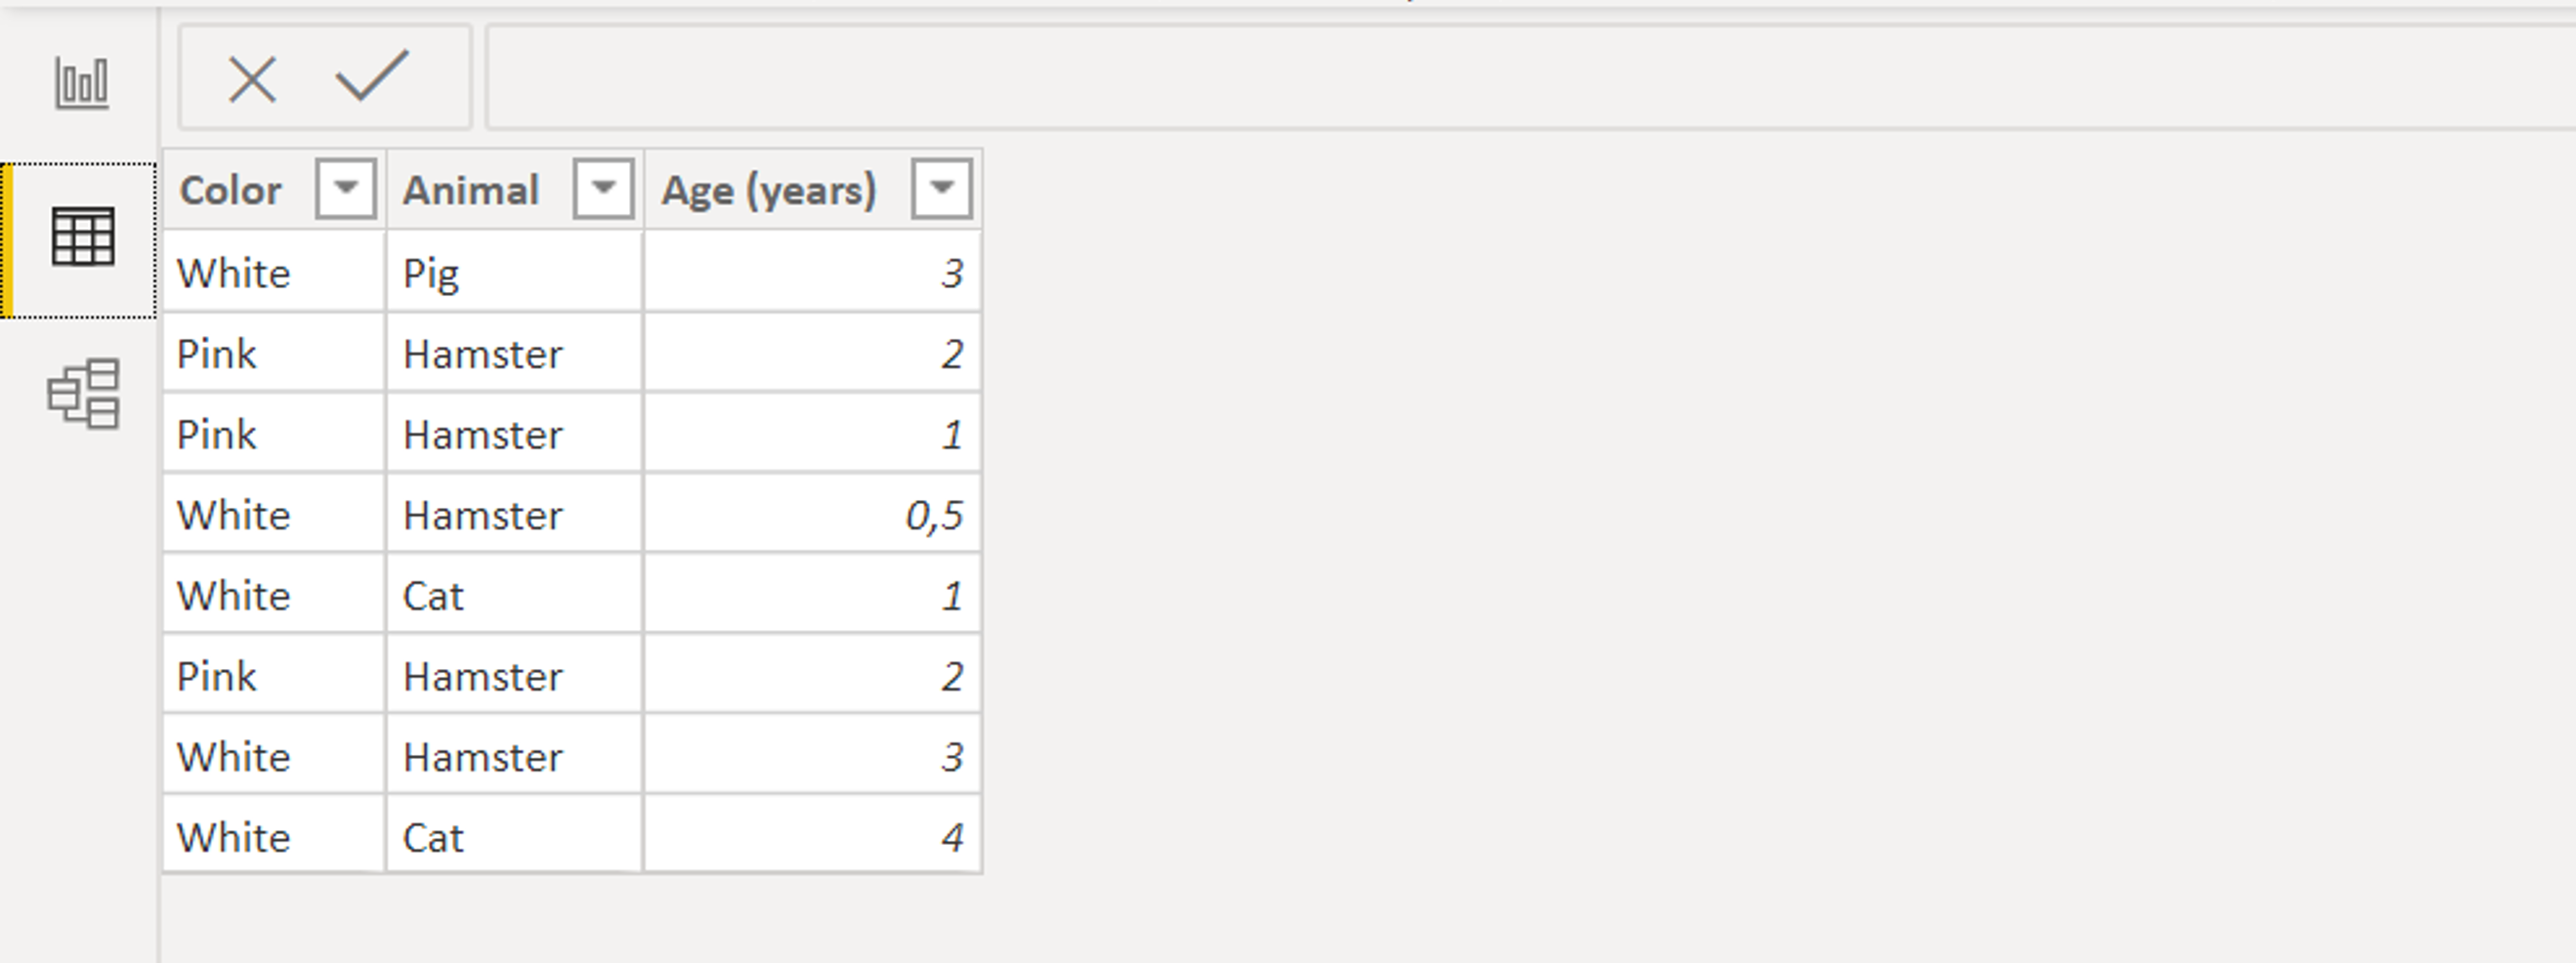
We will use this table with animals:
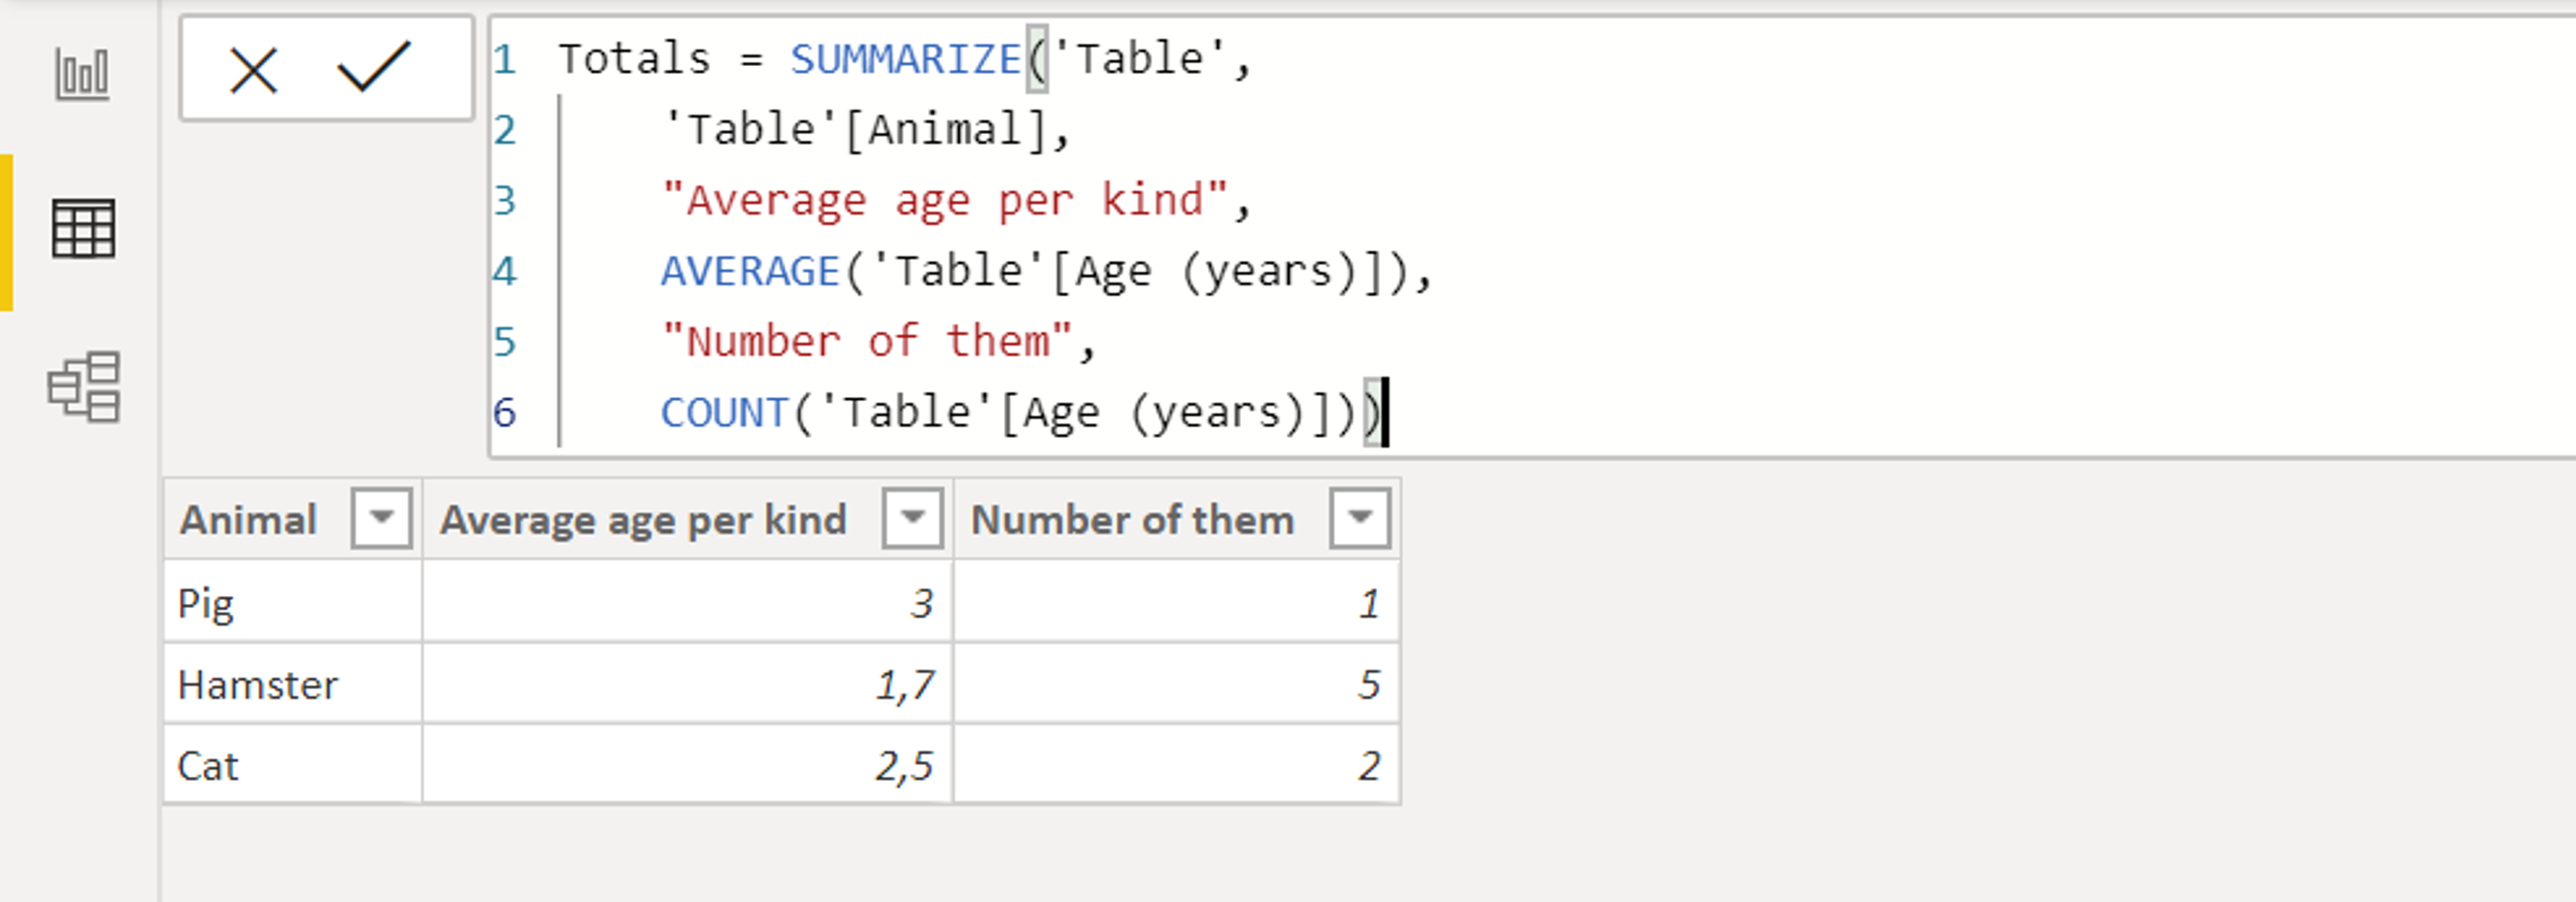
If you want to see, for example, average ages and total counts by animal kinds, write this:
Because:
The result will be like this:
You can simply use SUMMARIZE or GROUPBY to get the number of unique rows, based on more columns than 1.
![]()
![]()
Pište kdykoliv. Odpovíme do 24h
![]()
© exceltown.com / 2006 - 2023 Vyrobilo studio bARTvisions s.r.o.
explanation is very clear
This was exactly what I needed, thanks!
What if you need to join another table that contains the date?
To create a table containing just date you can use the Calendar function
your explanation is simple . thanks
What if you are summing based on the three categories? (ie, Goods, Goods Category, Weekday, Assistant)
it says syntax error on semicolon
Try to replace them by comma.
Question… This makes total sense. My question is this. I have a table that I summarized using my Calendar Table and then layering in calculations from related tables.
Summarize(Calendar, BOM, EOM, WeekBeginning, WeekEnding, WeekNo. “TotalOfWidgetsTable1”, Calculated(Count(WidgetId),Fitler(Table1,WidgetCreatedDate>=WeekEnding)),
“TotalOfWidgetsTable2”, Calculated(Count(WidgetId),Fitler(Table2,WidgetCreatedDate>=Weekending))
)
This seems to calculate the total widgets for both tables for each week, but when I compare these totals to say a measure the calculates the same value, the values form the summary table are much lower. Curious as to why? Are they not essentially do the same thing?