Našimi kurzy prošlo více než 10 000+ účastníků
2 392 ověřených referencí účastníků našich kurzů. Přesvědčte se sami
This article is about the GROUPBY function. It creates groups or subtotals in DAX (works similarly to Pivot Tables).
We will use this table with cars, that can be grouped by various columns.
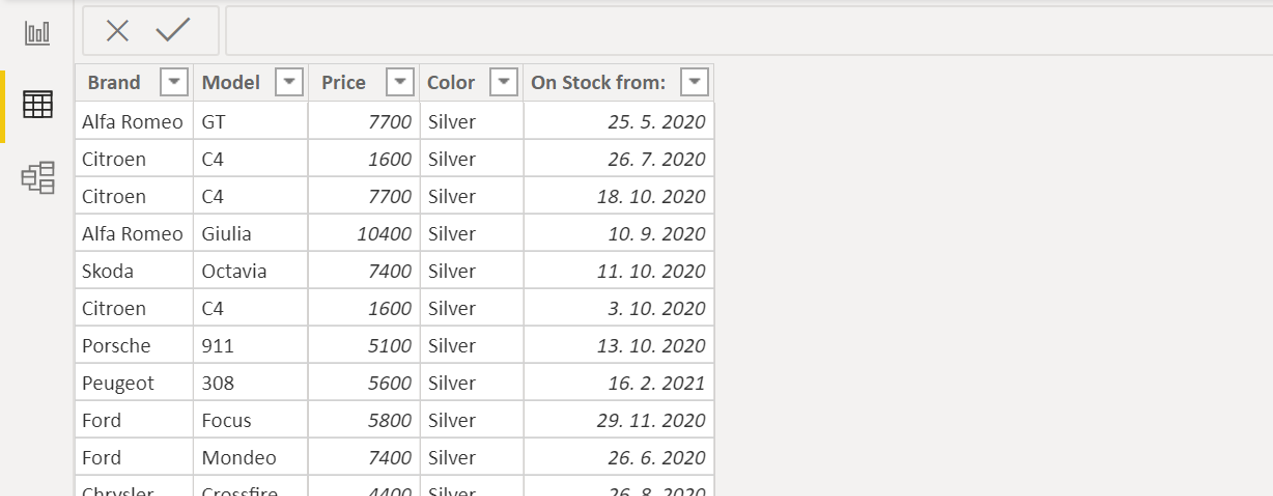
Let´s group the table by Brands ( = create a list of brands).
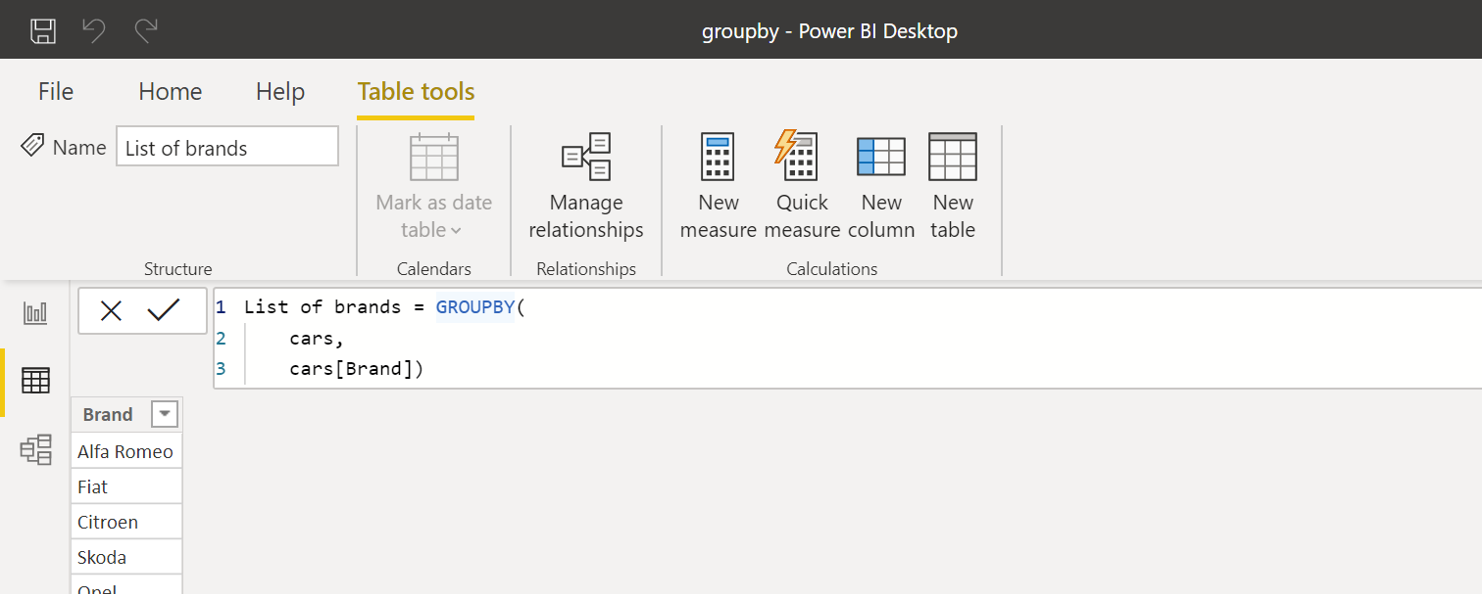
Create a new calculated table and define it by this command:
The syntax contains:
But what if you needed to group the table not only by Brand, but also by Models?
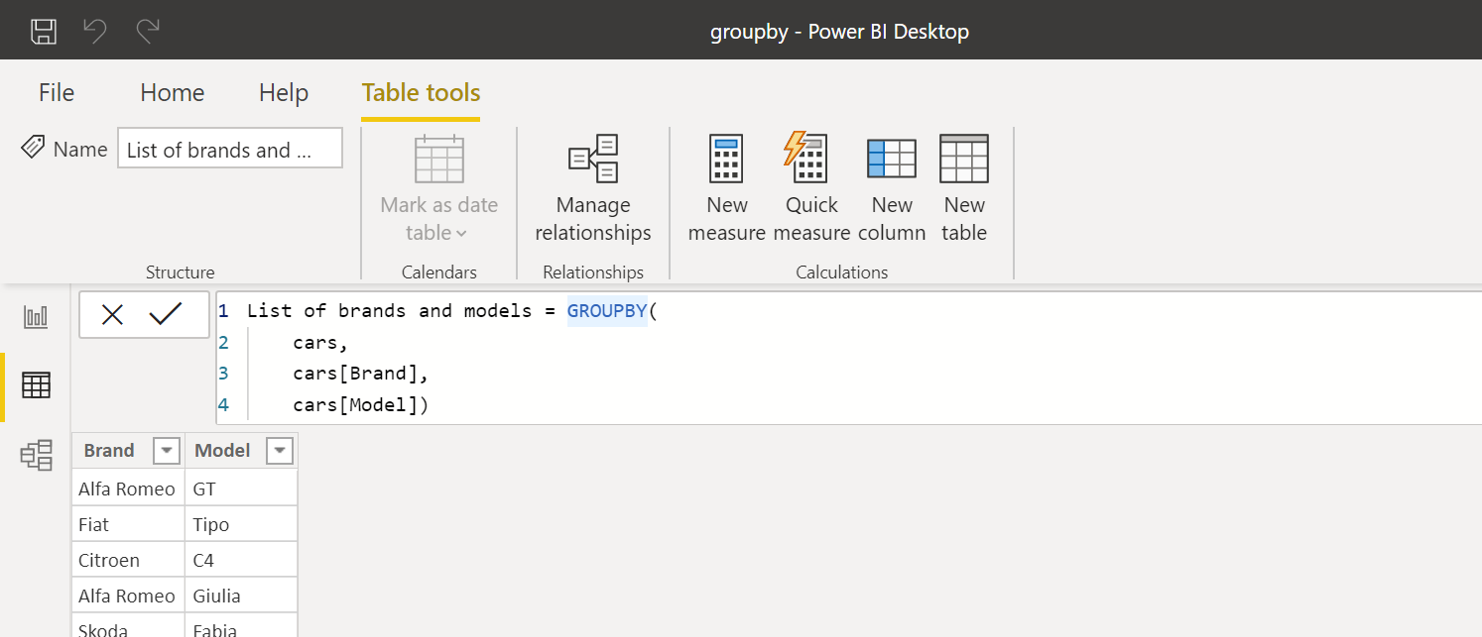
You can add new argument referencing the other column:
Now the syntax contains:
Off course, we can add some sums, counts or something like this. In this example I´d like to see the sums and counts:
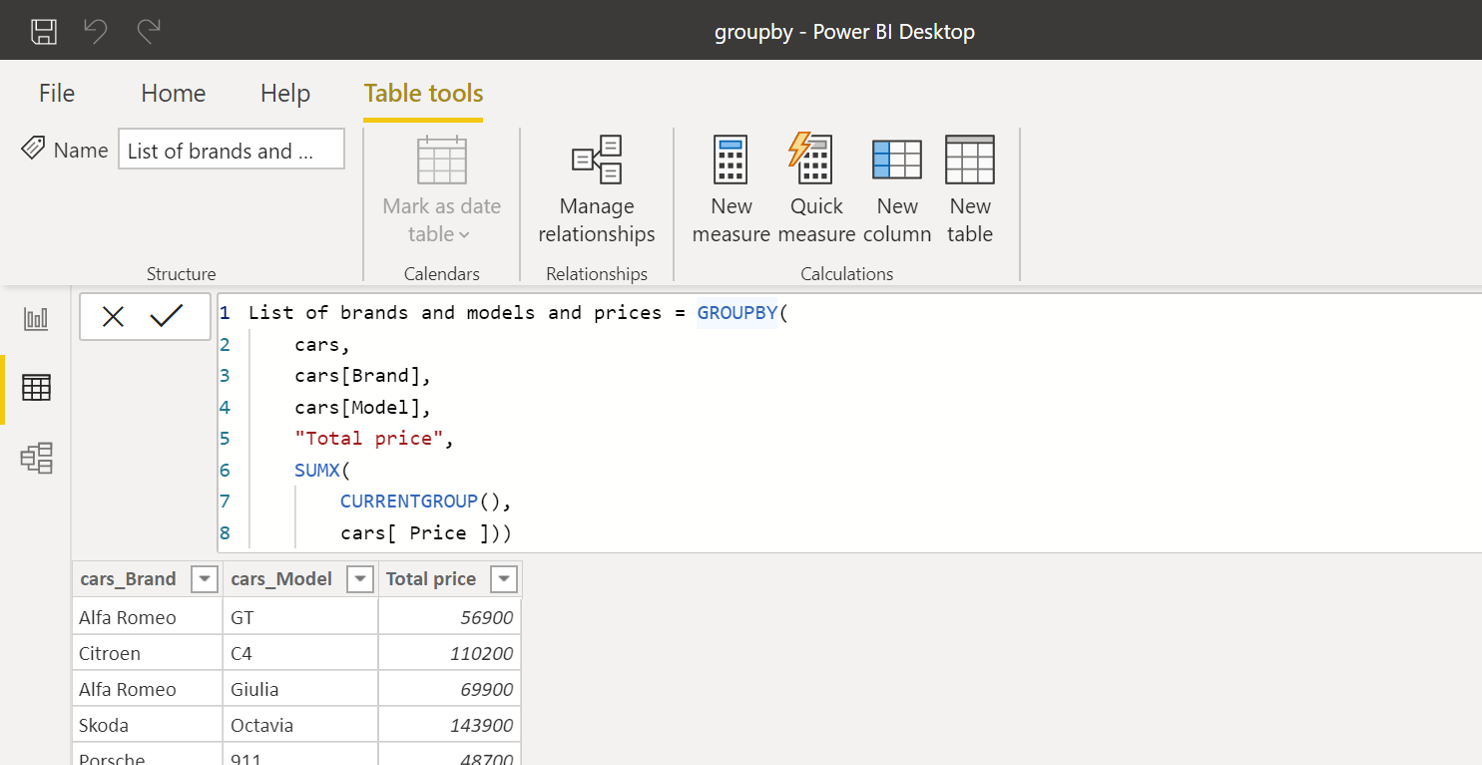
Now the syntax contains:
![]()
![]()
Pište kdykoliv. Odpovíme do 24h
![]()
© exceltown.com / 2006 - 2023 Vyrobilo studio bARTvisions s.r.o.
Hi. Good Article. I’d like to group by a table like that. But I need to be able to filter the information after group by per date. Is there any way to do that?
Saved my day. Thanks.
Is there a way to group by price range?
Range #Cars
$0 – $19,999
$20,000 – $29,999
$30,000 – $49,999
$50,000 +
Charles, after groupby table created, then develop measures to price ranges.