Našimi kurzy prošlo více než 10 000+ účastníků
2 392 ověřených referencí účastníků našich kurzů. Přesvědčte se sami
This article provides with a basic guideline how to compare a plan and reality in Power BI. This is meant to be more logical example rather than a concrete practical instruction. The data use are obviously simplified.
Please, see following tables. Table 1 comprises plans of individual traders for concrete months:
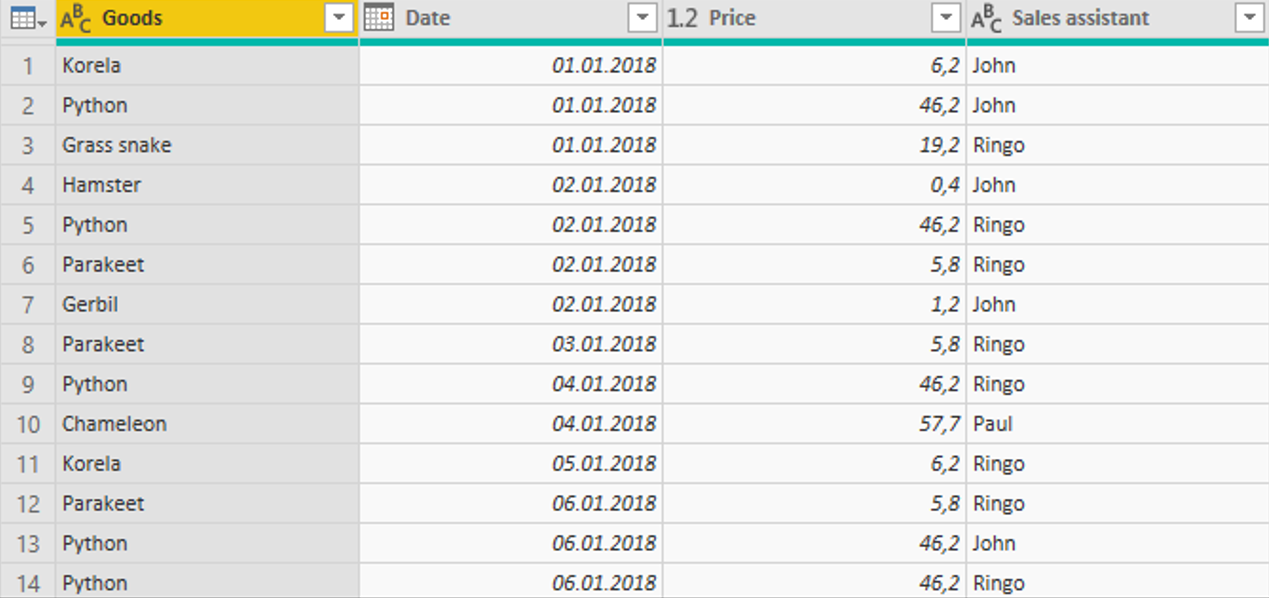
Table 2 comprises real sales per a year:

Our task is to create a graph, where fulfilment of a plan is illustrated in time and per a seller.
How to do it? First of all, in a query editor, we transform data to standard table using Unpivot tool.
So, together with renaming of columns we derive a standard table that we can work with.
We close the query editor. Now, the problem of how to compare specific days (that depict real sales) with months (that depict planned sales) must be solved. Therefore, it is necessary to have both tables in months or in days. I prefer to have both tables in days.
Therefore, Table 1 (which includes plans) will be extended with a new column with a date.
Now we need to connect the tables. We will do it via a new table with the dates – so let´s create it using CALENDAR function in DAX.

Now, we will connect the table containing plan with a table containing actual sales.
Since now, we can connect plans and actuals in one chart in and group them by dates. A date must be from from a „virtual table“ to which everything is connected.
And we are ready now. If you feel like continuing, we can add selection with regards to sales persons. To do that, we create a virtual table with names of all people. To be sure, we extract them from both plan and reality – for the case that in one table is someone missing.
This table we can connect with first two original tables.
We can work with names of sales persons in a different graph similarly as with dates. The graphs are certainly mutually filtered.
It is possible to download a completed solution here.
2 392 ověřených referencí účastníků našich kurzů. Přesvědčte se sami
![]()
![]()
Pište kdykoliv. Odpovíme do 24h
© exceltown.com / 2006 - 2023 Vyrobilo studio bARTvisions s.r.o.