Našimi kurzy prošlo více než 10 000+ účastníků
2 392 ověřených referencí účastníků našich kurzů. Přesvědčte se sami
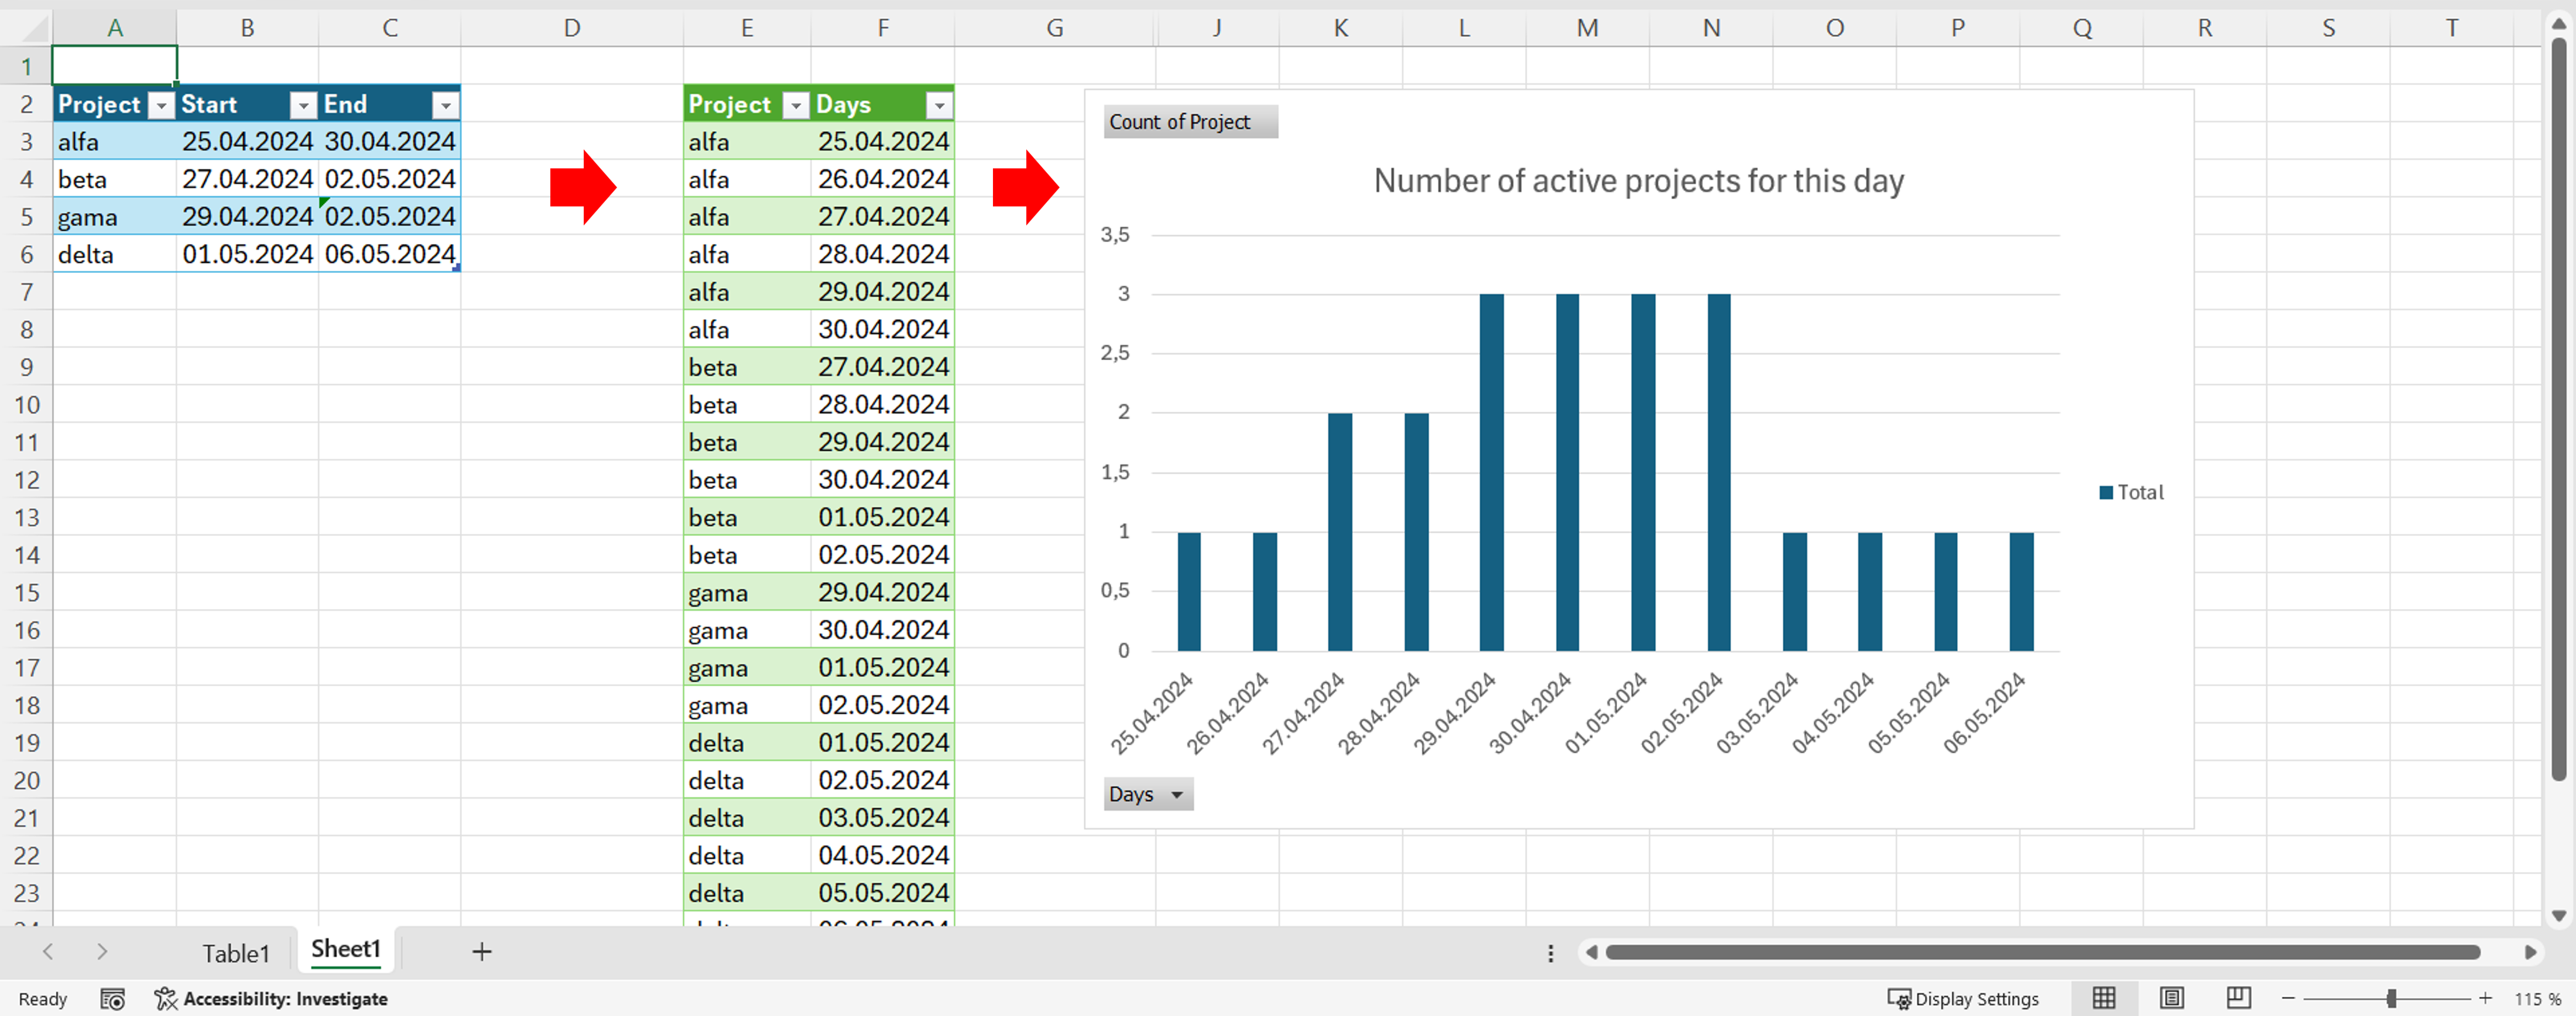
The article describes how to convert a table, where one row indicates the period from-to, to a table where one row, covering, for example, a period of three days, is replaced by three rows – each for one day. This can be very useful for a number of calculations.
E.g. here we will turn the overview of projects into a table and then a graph that shows how many active projects are active for each day.
If we don’t first divide the table into several rows, we can’t make such a chart, pivot table, visual. (But we could make a Gantt chart, for example).
The instructions are valid for both Excel and Power BI.
How to start?
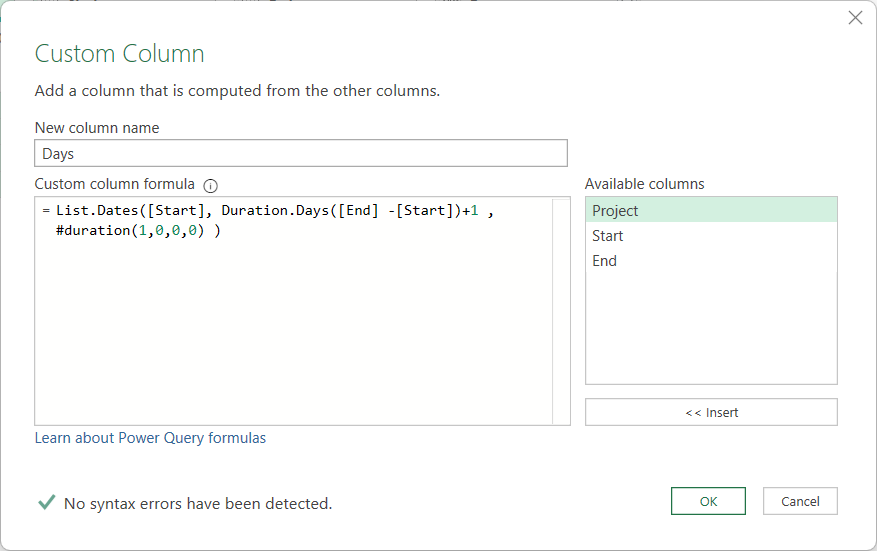
In Power Query add this custom column:
Note: when working with numbers instead of calendar dates, you can use this easier way:
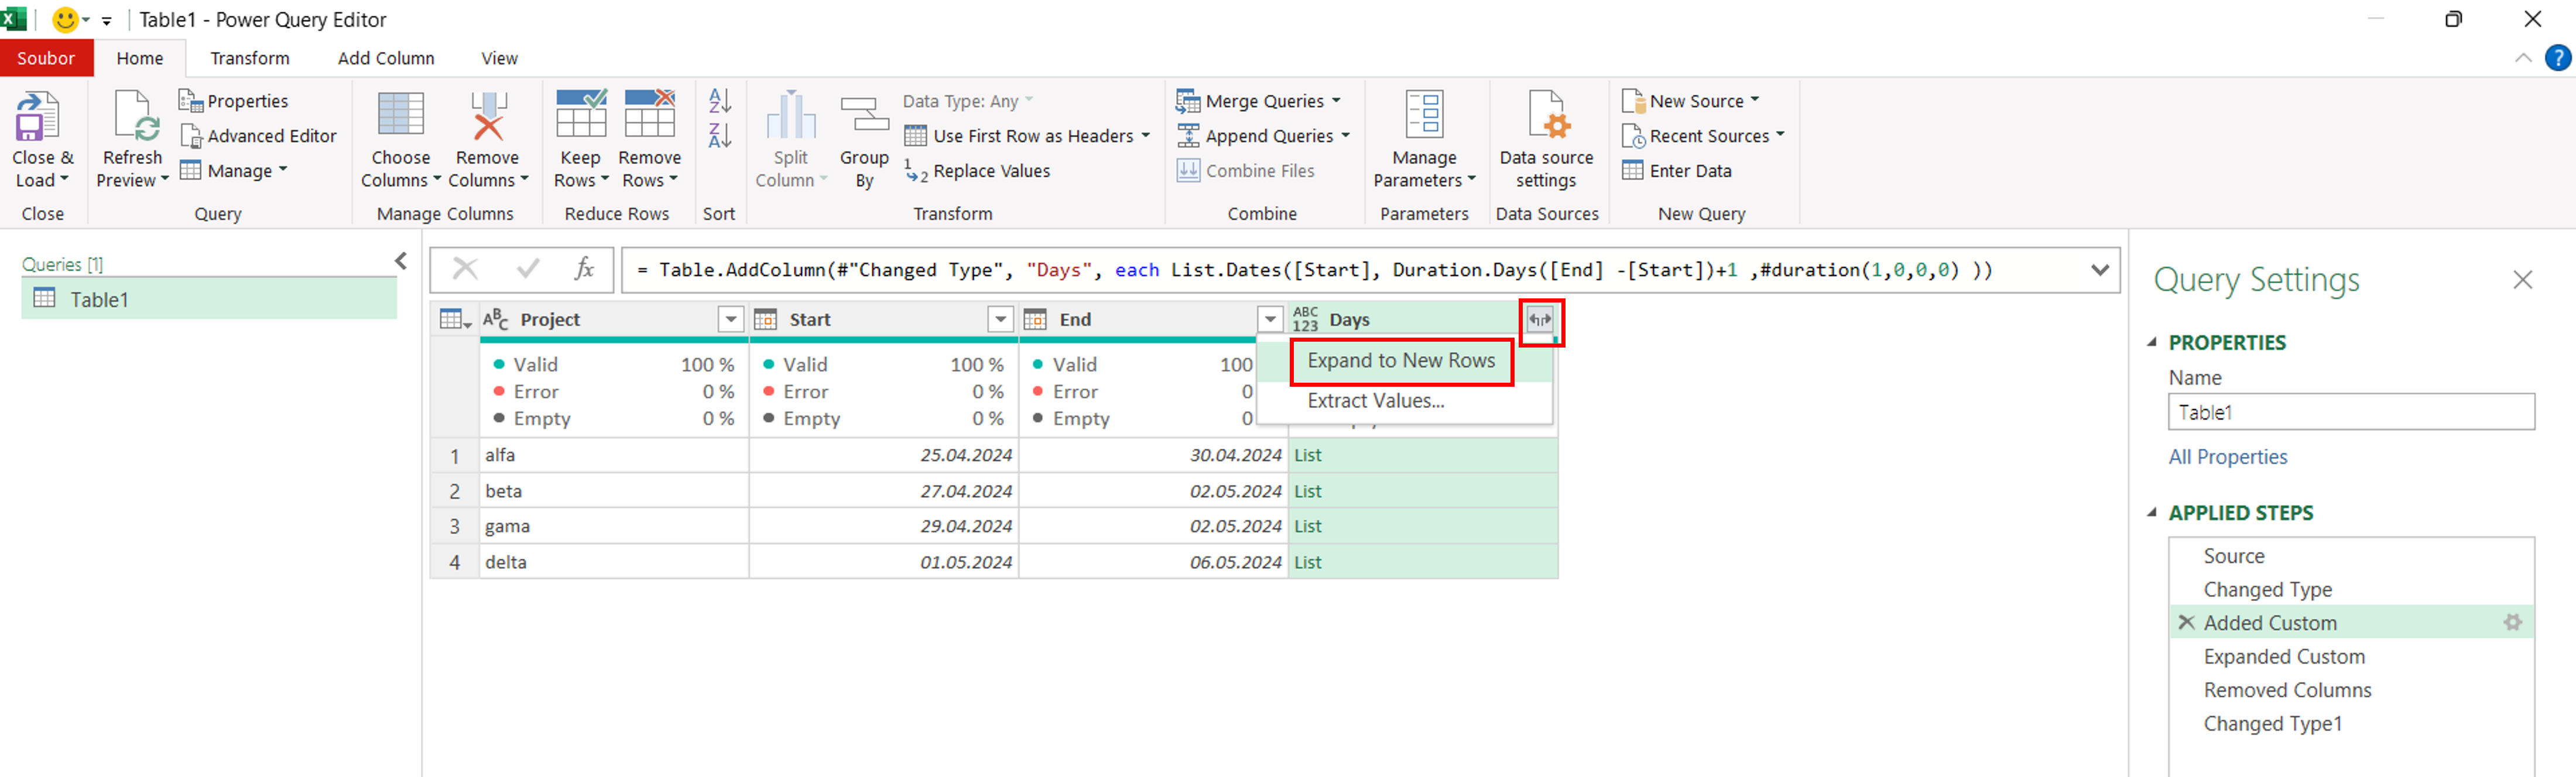
Anyway, you get a list, that has to be expanded into rows.
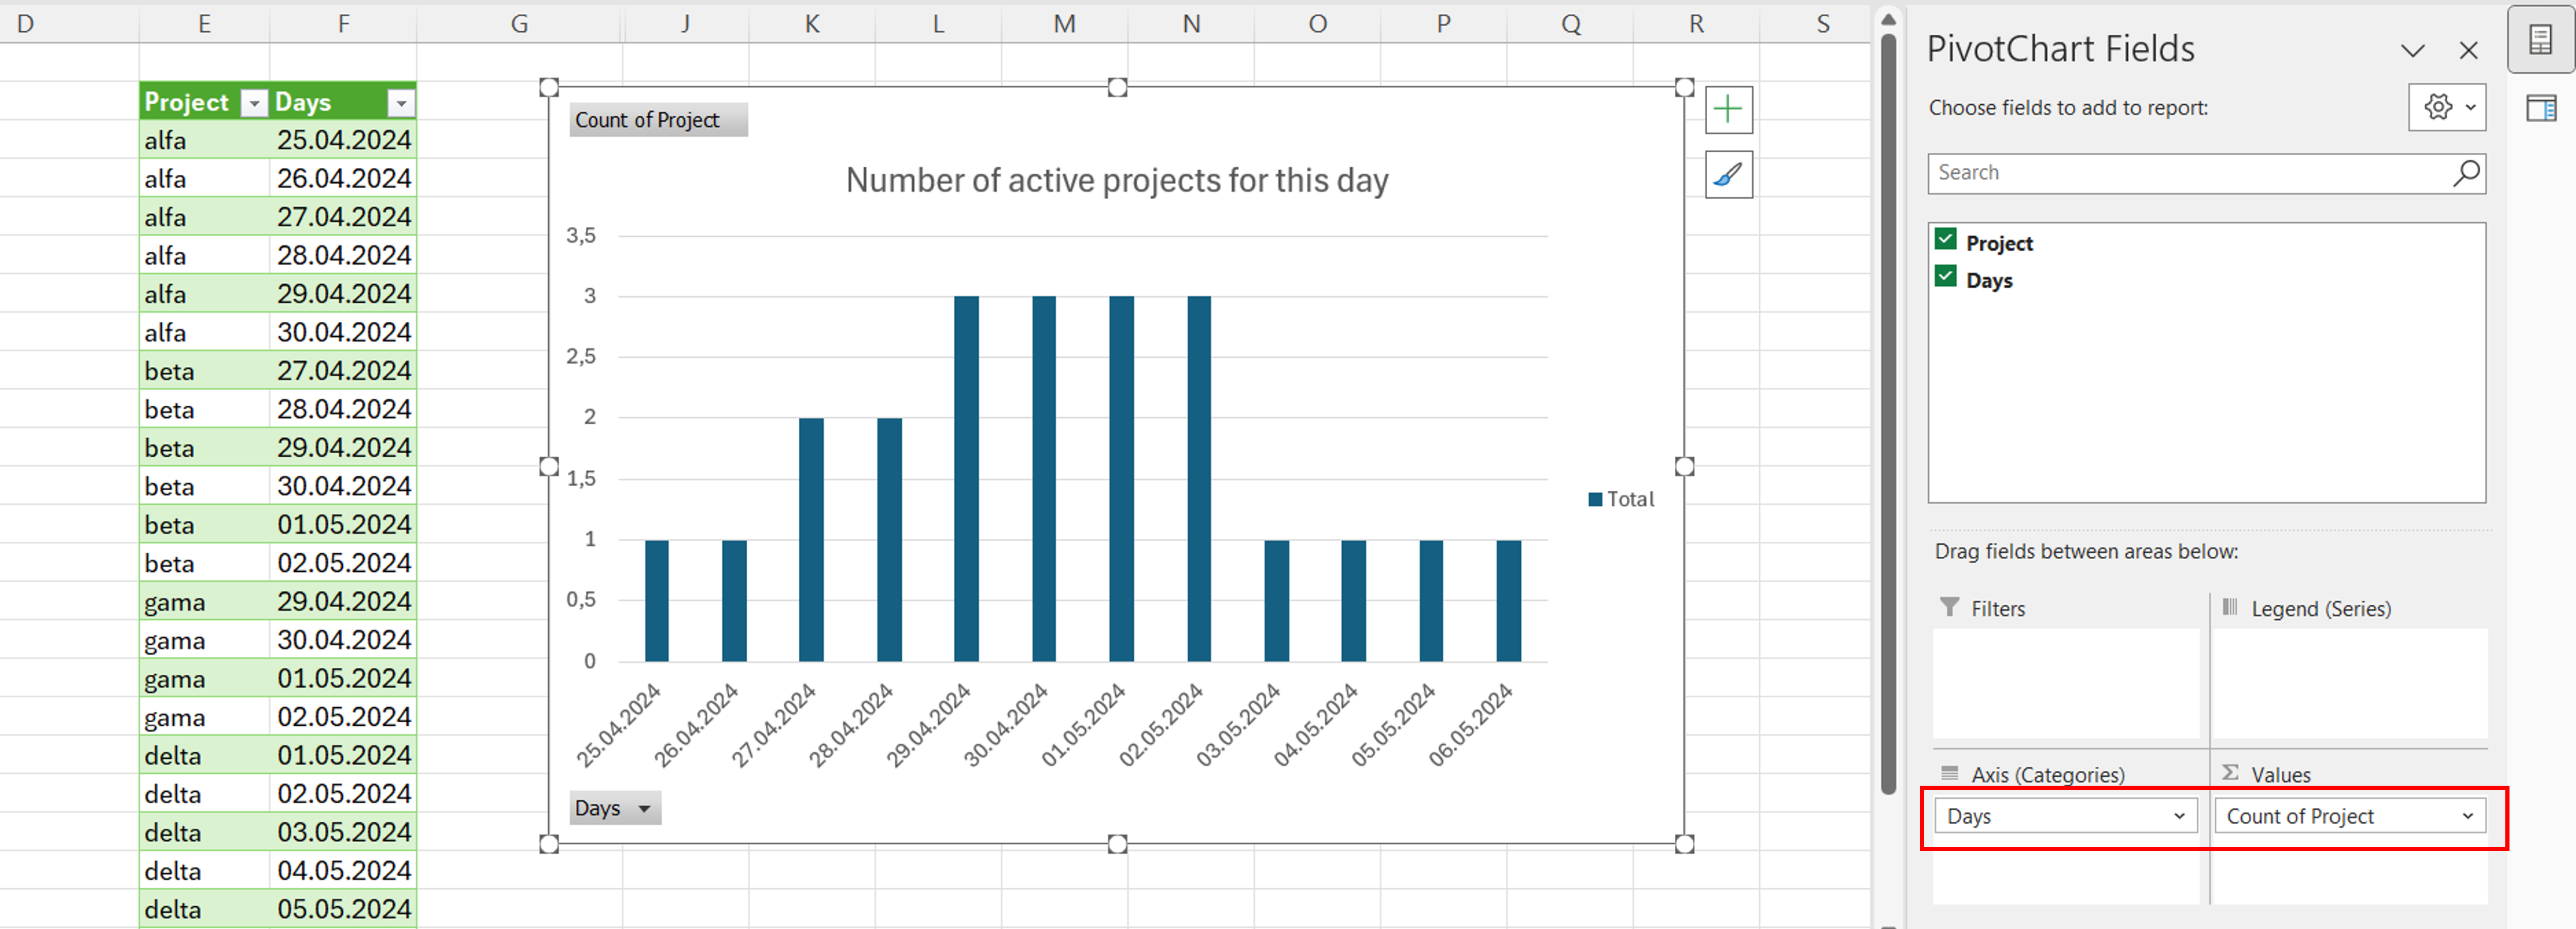
Now you can do anything from this table – pivot tables, charts, visuals, whatever…
![]()
![]()
Pište kdykoliv. Odpovíme do 24h
![]()
© exceltown.com / 2006 - 2023 Vyrobilo studio bARTvisions s.r.o.