Našimi kurzy prošlo více než 10 000+ účastníků
2 392 ověřených referencí účastníků našich kurzů. Přesvědčte se sami
This article describes combination of website traffic data with other information.
In this example we will evaluate the effectivity of advertising campaing – for one month we have a numbers for add for each day together with GA data..
The question is – do the ads have some impact on website traffic?
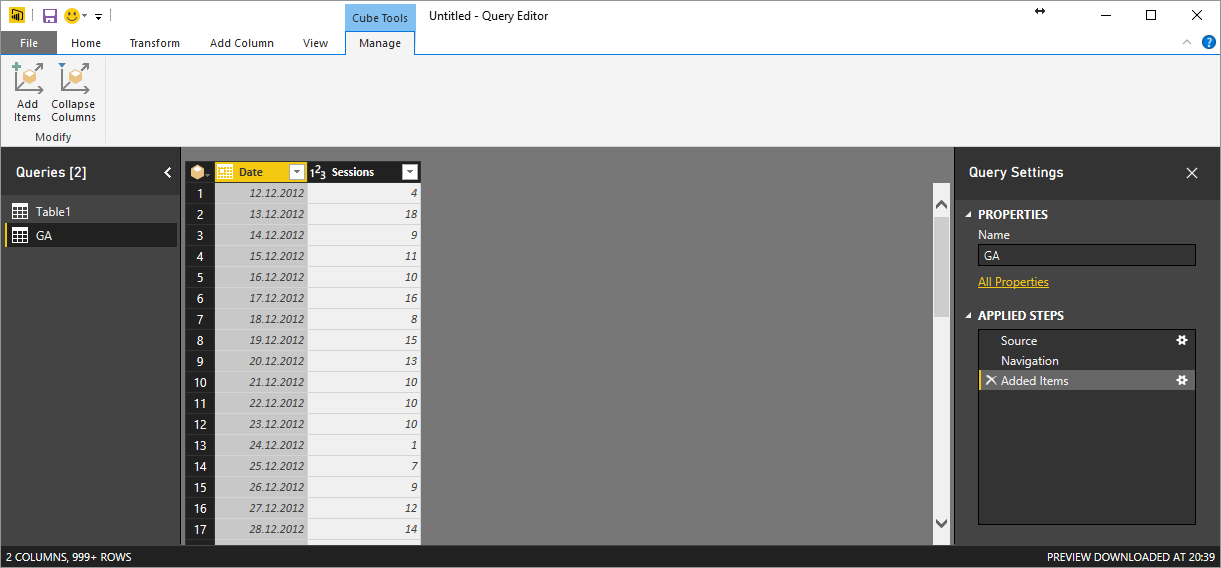
We will use two sources. One of them is the connection to Google Analytics data (click here for more info):
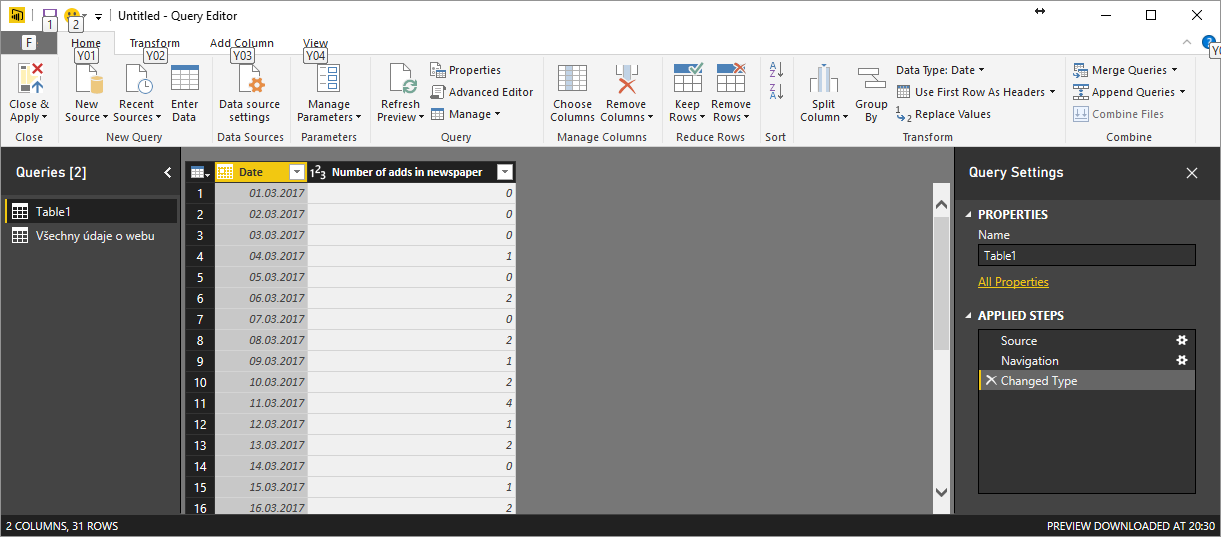
The second source is this excel table, containing numbers adds published each day.

This table will be uploaded to Power BI:
Then we will merge the tables – in another words we will add the numbers from one table to the another one. It can be done in both directions, for now we will assign the numbers from Google Analytics to the table with ads.
First let´s create the relationship between tables (make sure the key (date) is the same datatype in both tables):

Then we will assign the data, using DAX and Related function.
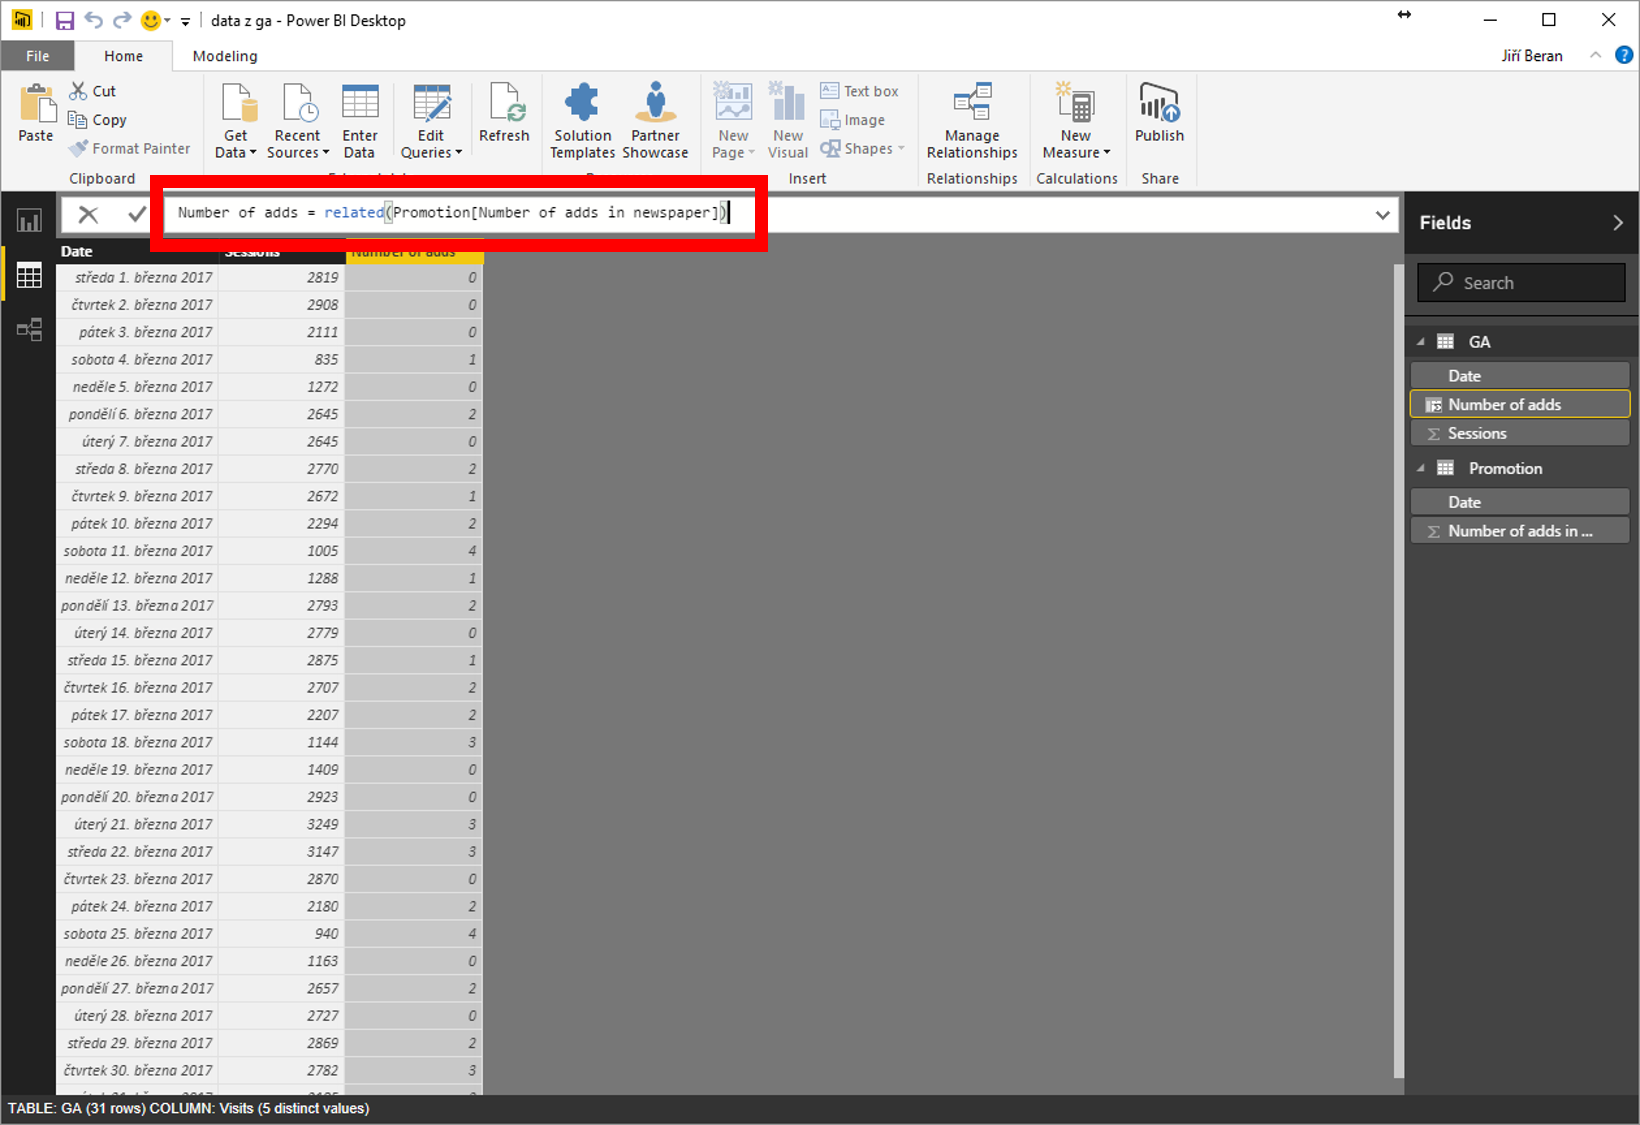
From now we have one table with all important data.
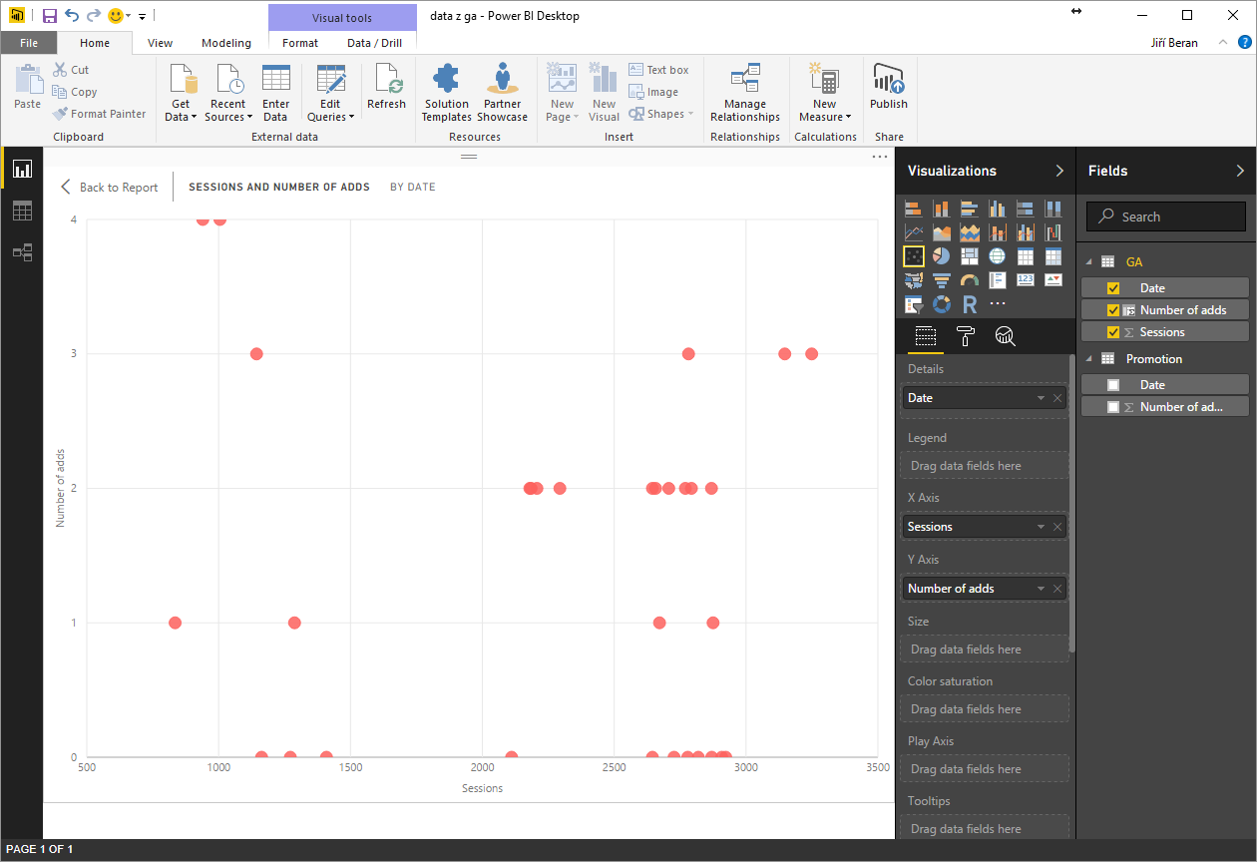
We can create a chart, describing both columns. “Line and Clustered Column Chart” would be nice.
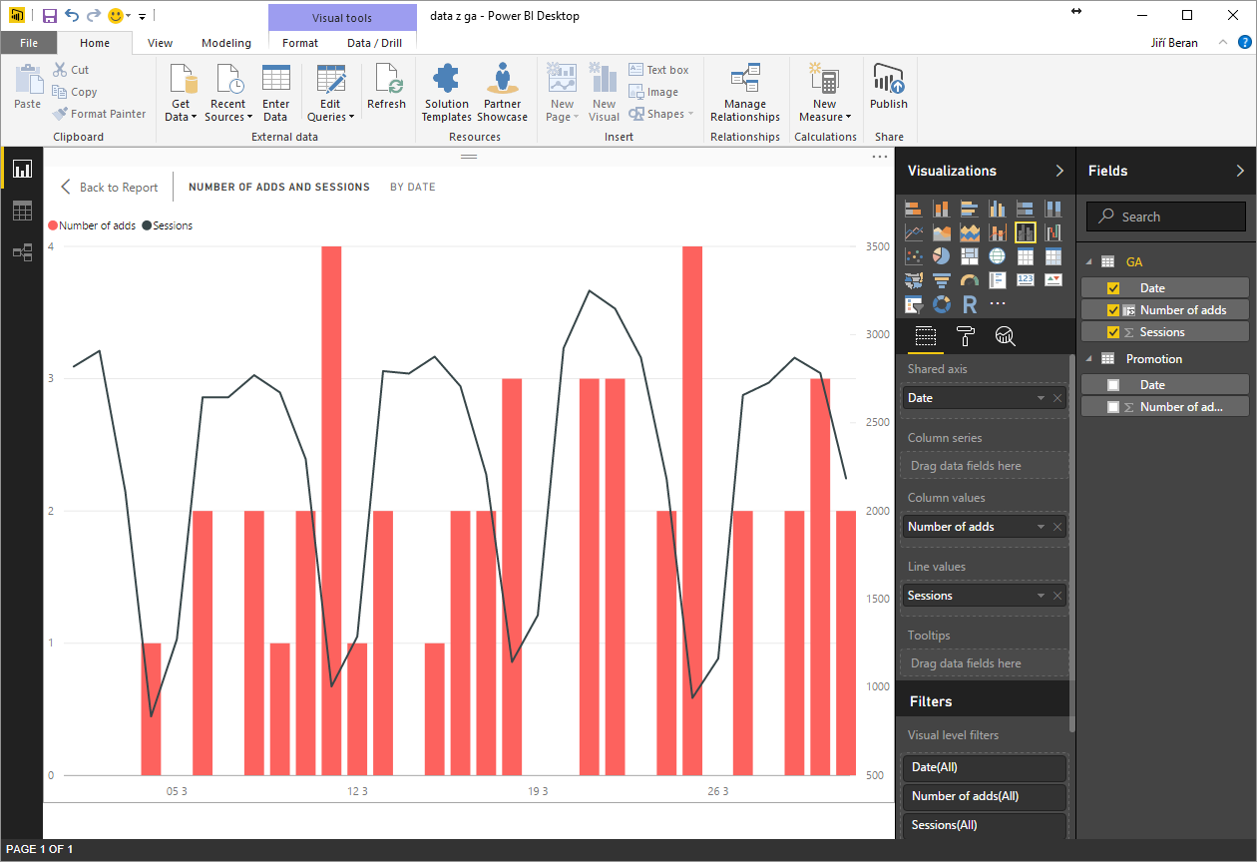
It is crystal clear, that the ads had no impact on web traffic. Similar information could be seen in Scatter chart:
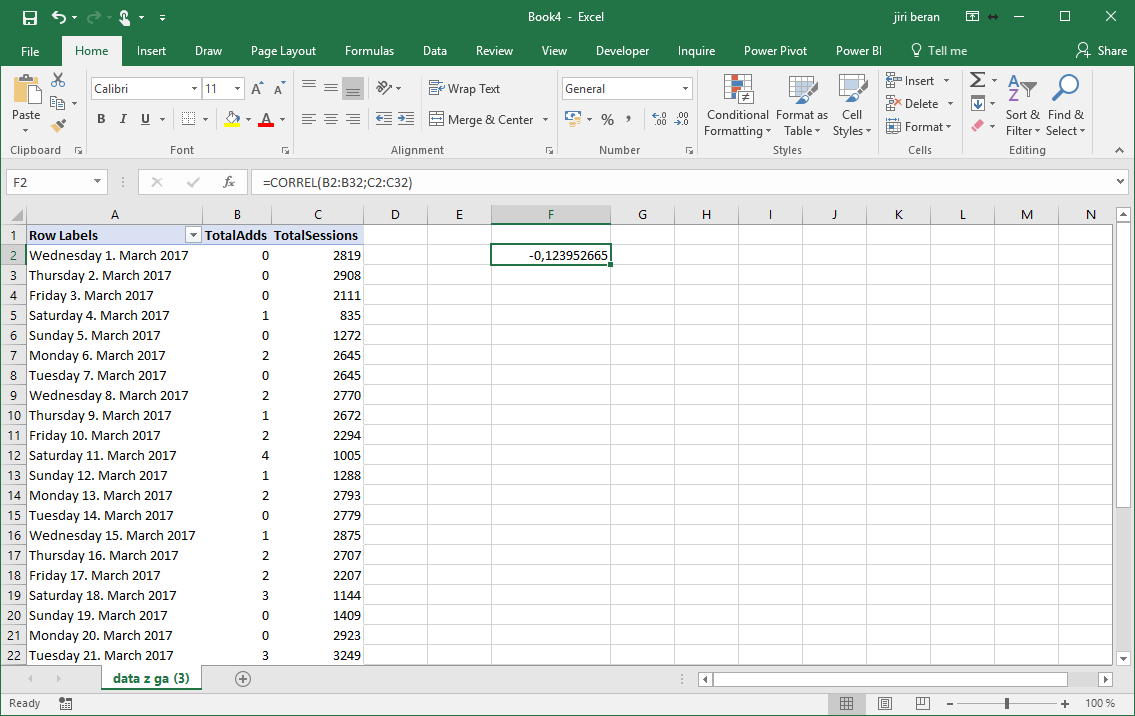
The data analysis can continue after publishing to Excel.
For example we can calculate the correlation coefficient (CORREL function). Its very low value confirms that the columns are almost independent and our advertisements have no impact on web traffic.
![]()
![]()
Pište kdykoliv. Odpovíme do 24h
![]()
© exceltown.com / 2006 - 2023 Vyrobilo studio bARTvisions s.r.o.