SAMEPERIODLASTYEAR – comparison with previous year (DAX – Power Pivot, Power BI)
This is about the SAMEPERIODLASTYEAR function. As can be seen from its long name, we can use it to compare some indicators year-on-year. Its result generally makes no sense as itself – it usually makes sense with some other function like CALCULATE and with some of the visuals in Power BI (or Pivot Table in Excel – it it´s based on Data Model).
Let´s start with this table:
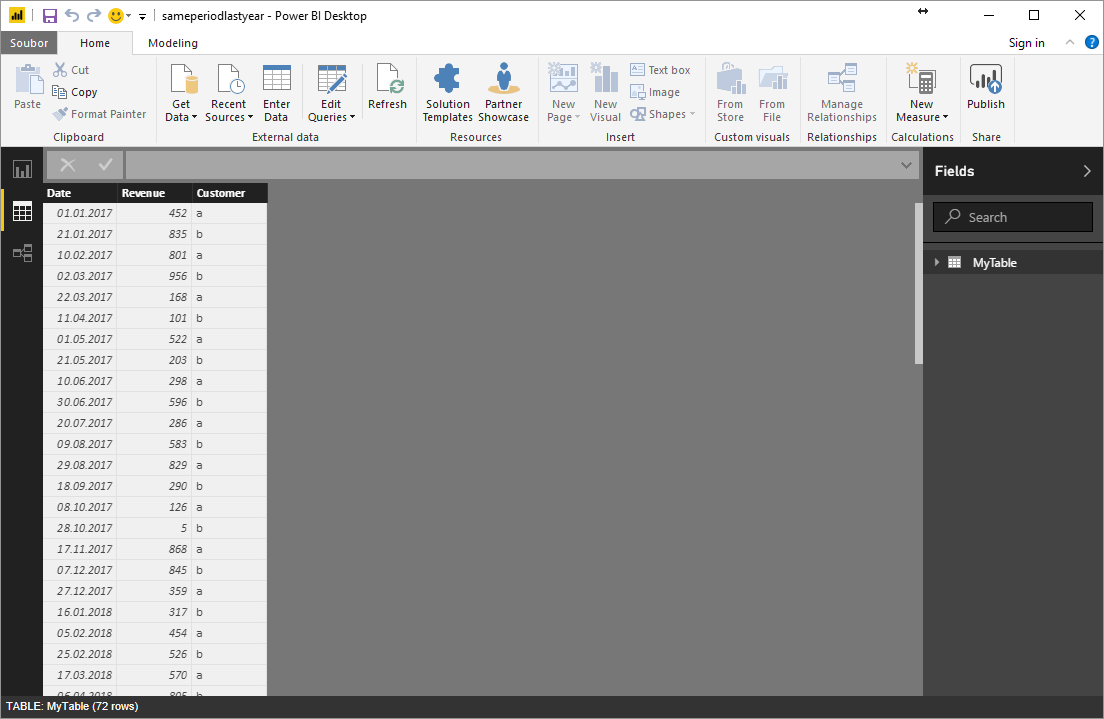
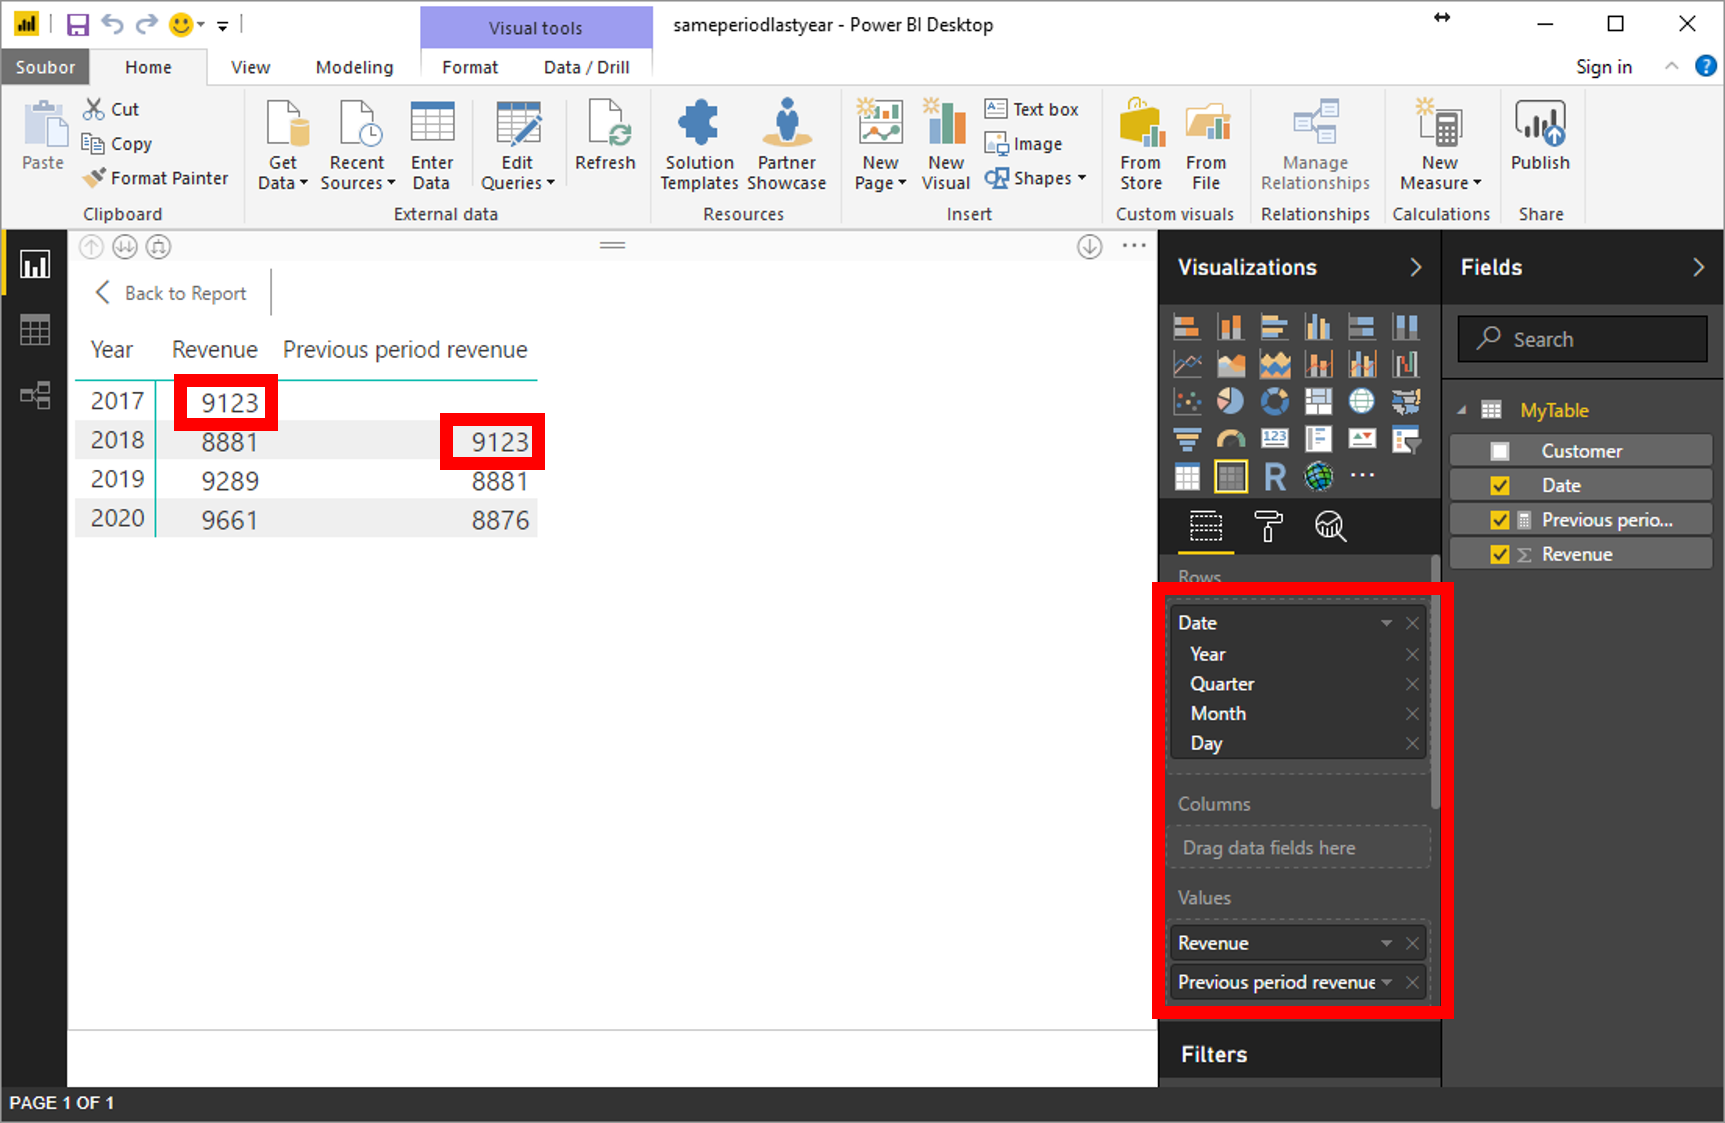
We are going to create this table comparing year-on-year results.
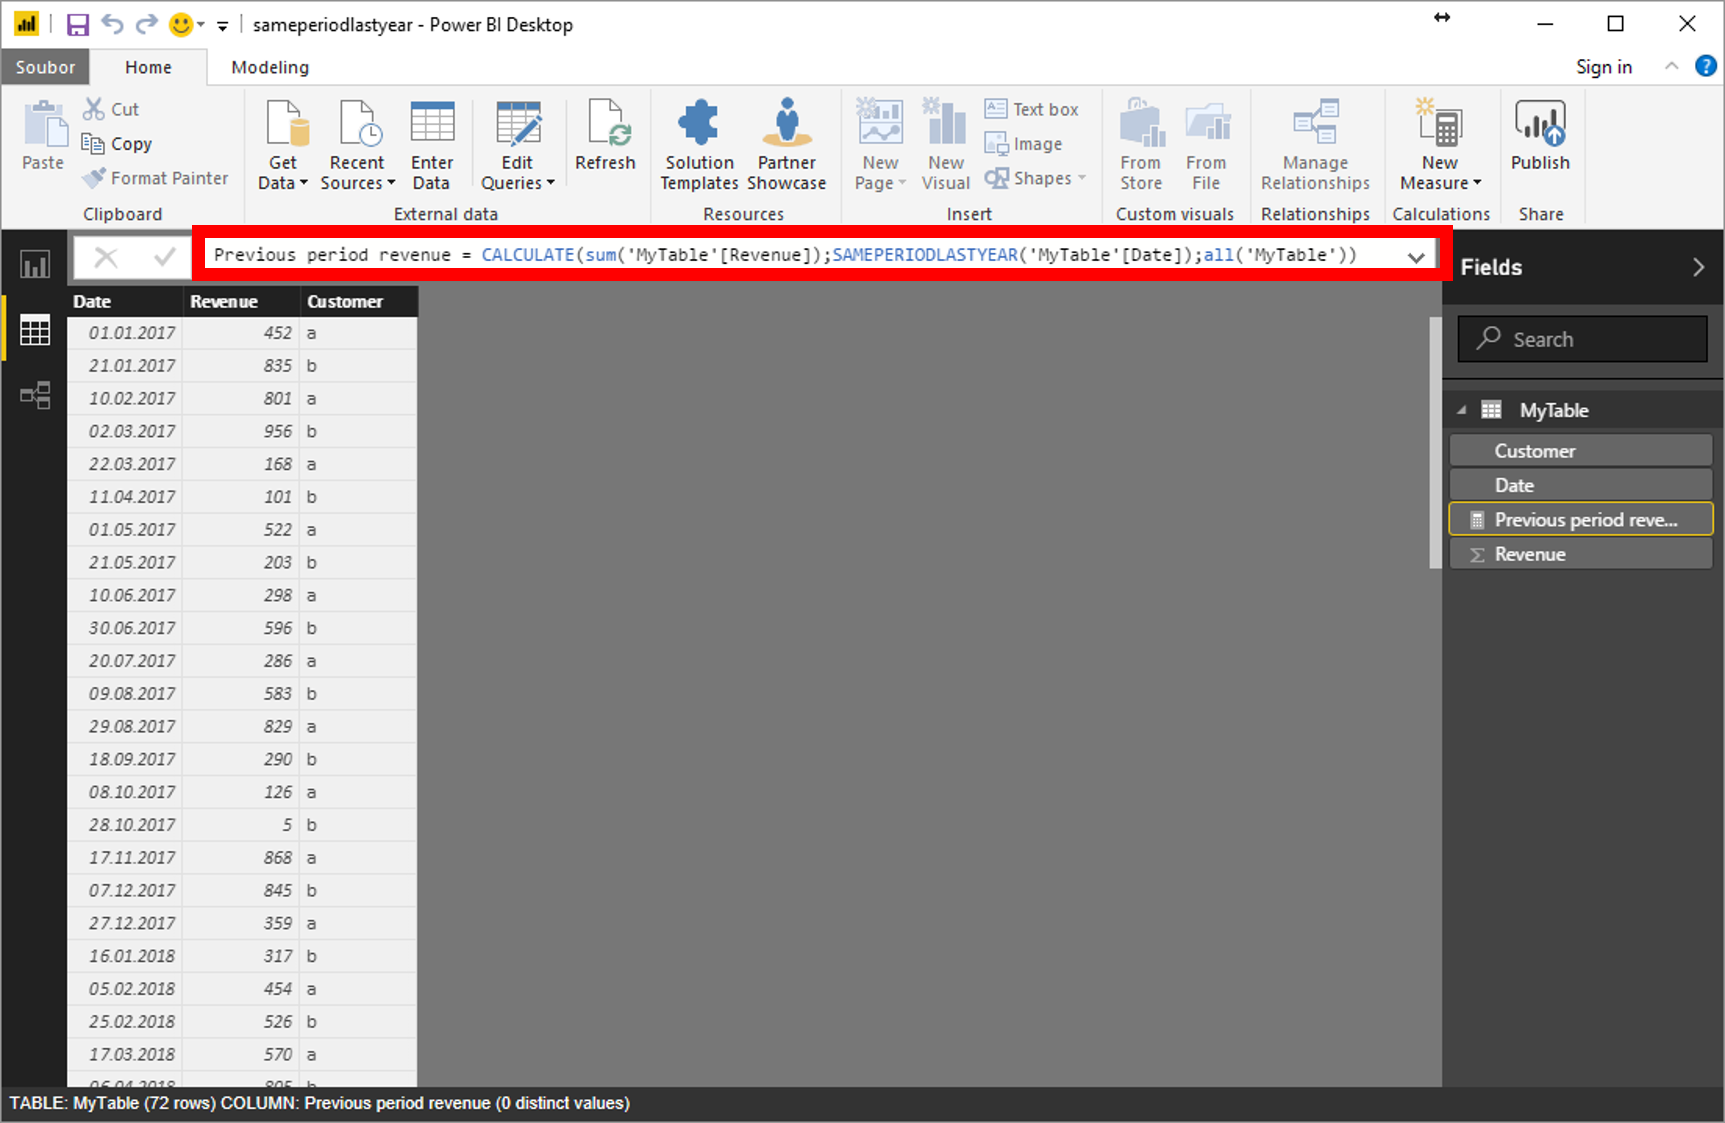
How to do it? We will start with new measure creation:
- Previous period = CALCULATE(SUM(‘MyTable'[Revenue]);SAMEPERIODLASTYEAR(‘MyTable'[Date]);ALL(‘MyTable’))
Because:
- Previous period – name of new measure
- CALCULATE – calculate combines results of included functions (SUM, SAMEPERIODLASTYEAR, ALL)
- SUM(‘MyTable'[Revenue]) – becuase we want to sum the revenue (not count etc.)
- SAMEPERIODLASTYEAR(‘MyTable'[Date]) – declares, that the values are moved one year back, based on “Date” column.
- ALL(‘MyTable’) – all rows from MyTable are used
You can simply subtract Revenue and “Previous period” measure and see the improvement. Any way, at the end we have to use some visual to present the results – as can be seen on the second image.
SAMEPERIODLASTYEAR can be little bit weird when working with filters / slicers. More about this problem and its solution is here.
Wonderful post! Is possible to modify this calculations to integrate a parameter (say “year choice”), which will then the be year used instead of simply the previous year of the same period?
Probably the PARALELLPERIOD function can be useful.
Thank you for this wonderful post. Question. What if I want to display current vs prior year number by LOB? Currently every row is repeating totals figure for prior year for each LOB. Thanks
Thank you! This really worked!! <3
Great explanation!
Thx, it help me a lot