Našimi kurzy prošlo více než 10 000+ účastníků
2 392 ověřených referencí účastníků našich kurzů. Přesvědčte se sami
This is about decision trees in Power BI.
Let´s use this table, provided by Microsoft – for download click here.
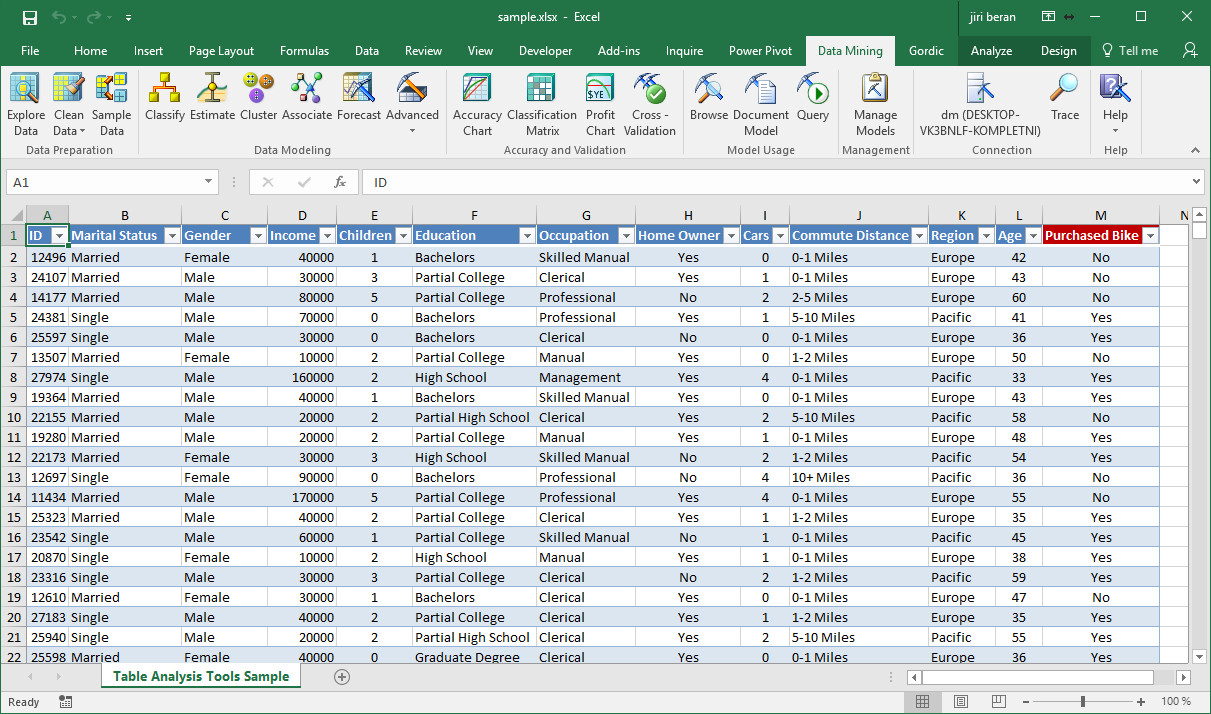
We´d like to see which factors has impact on whether customer buys or doesn´t buy a bike.
Download the Decision tree custom visual.
Load data and put Purchased bike to Target Variable, and some variables to Input Variables. There should be variables with estimated impact on target variable.
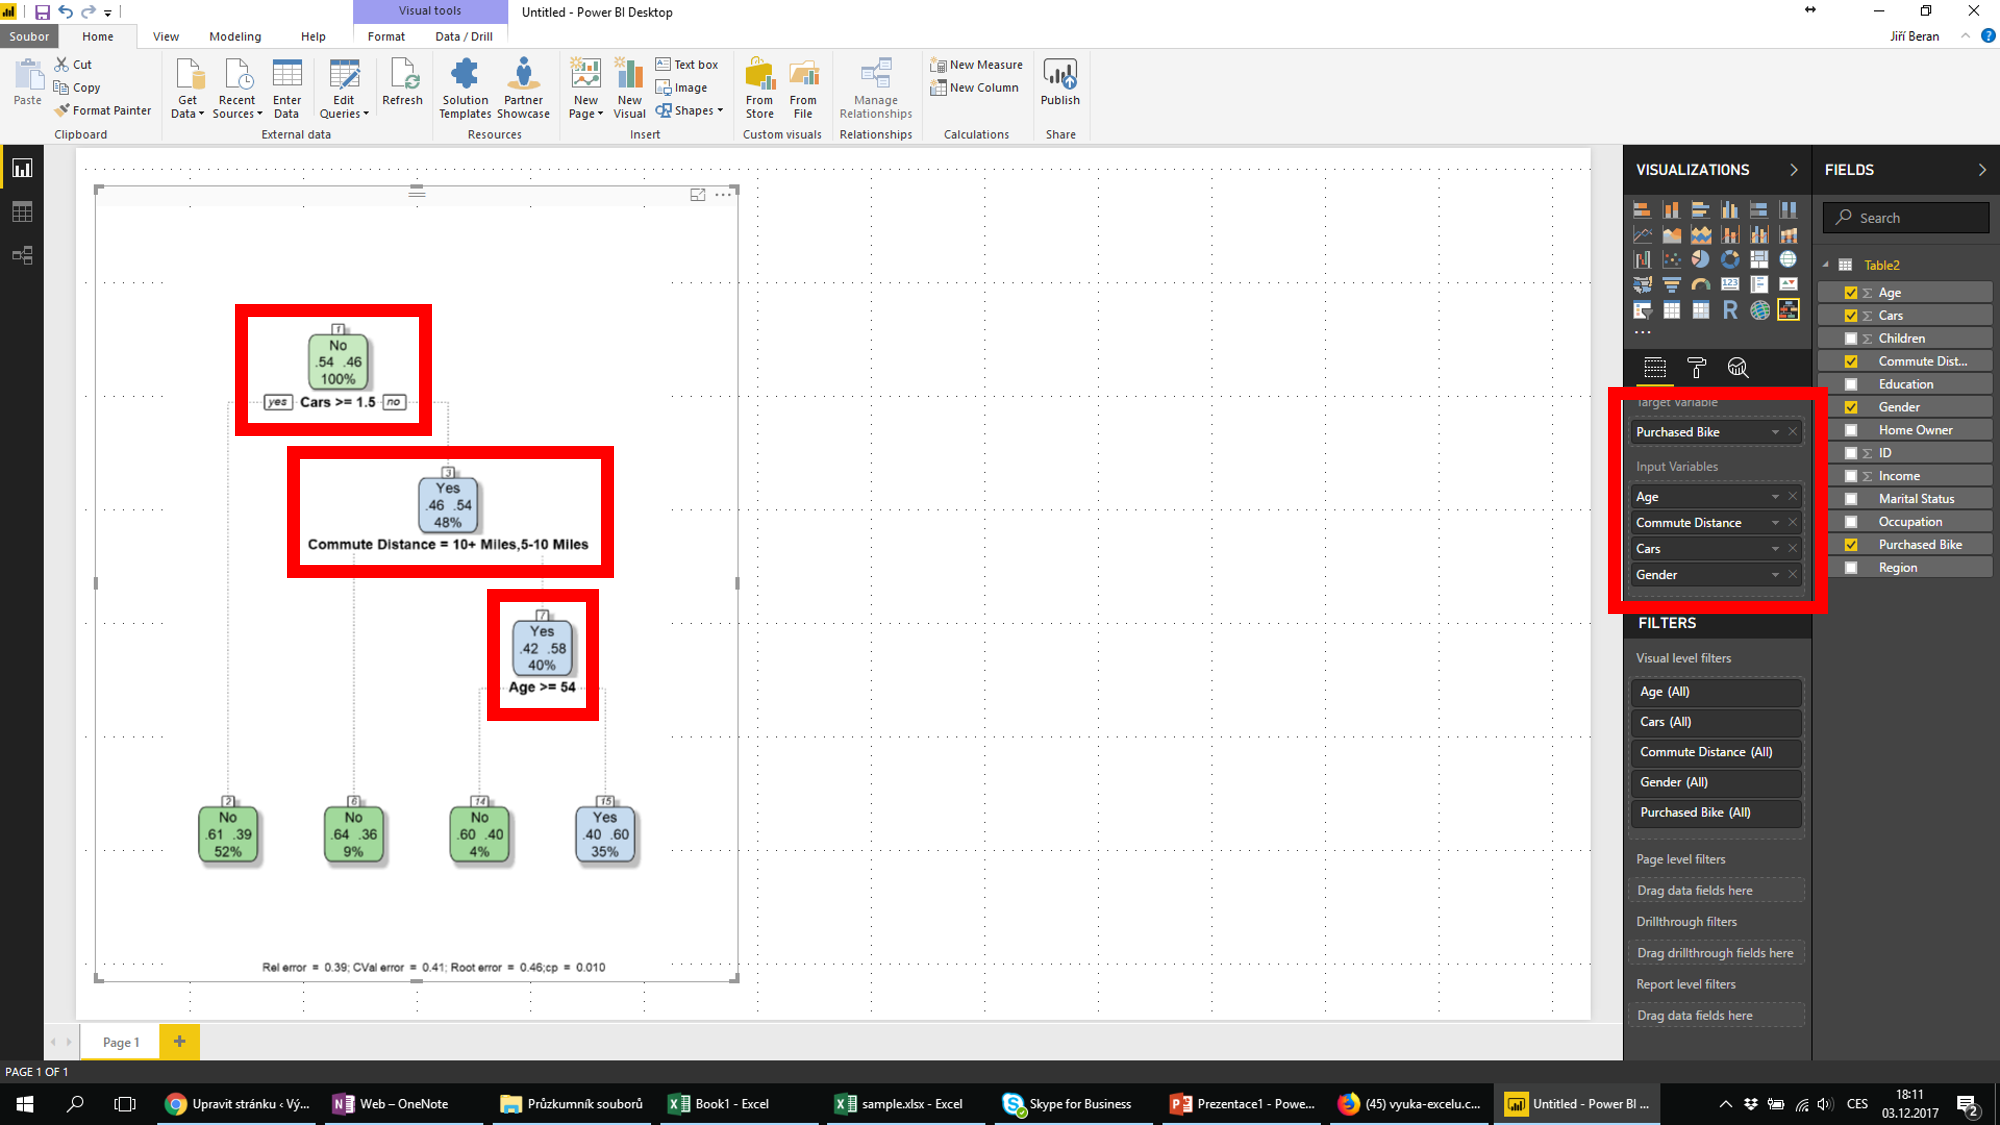
The tree is created.
The pbix file can be downloaded from here.
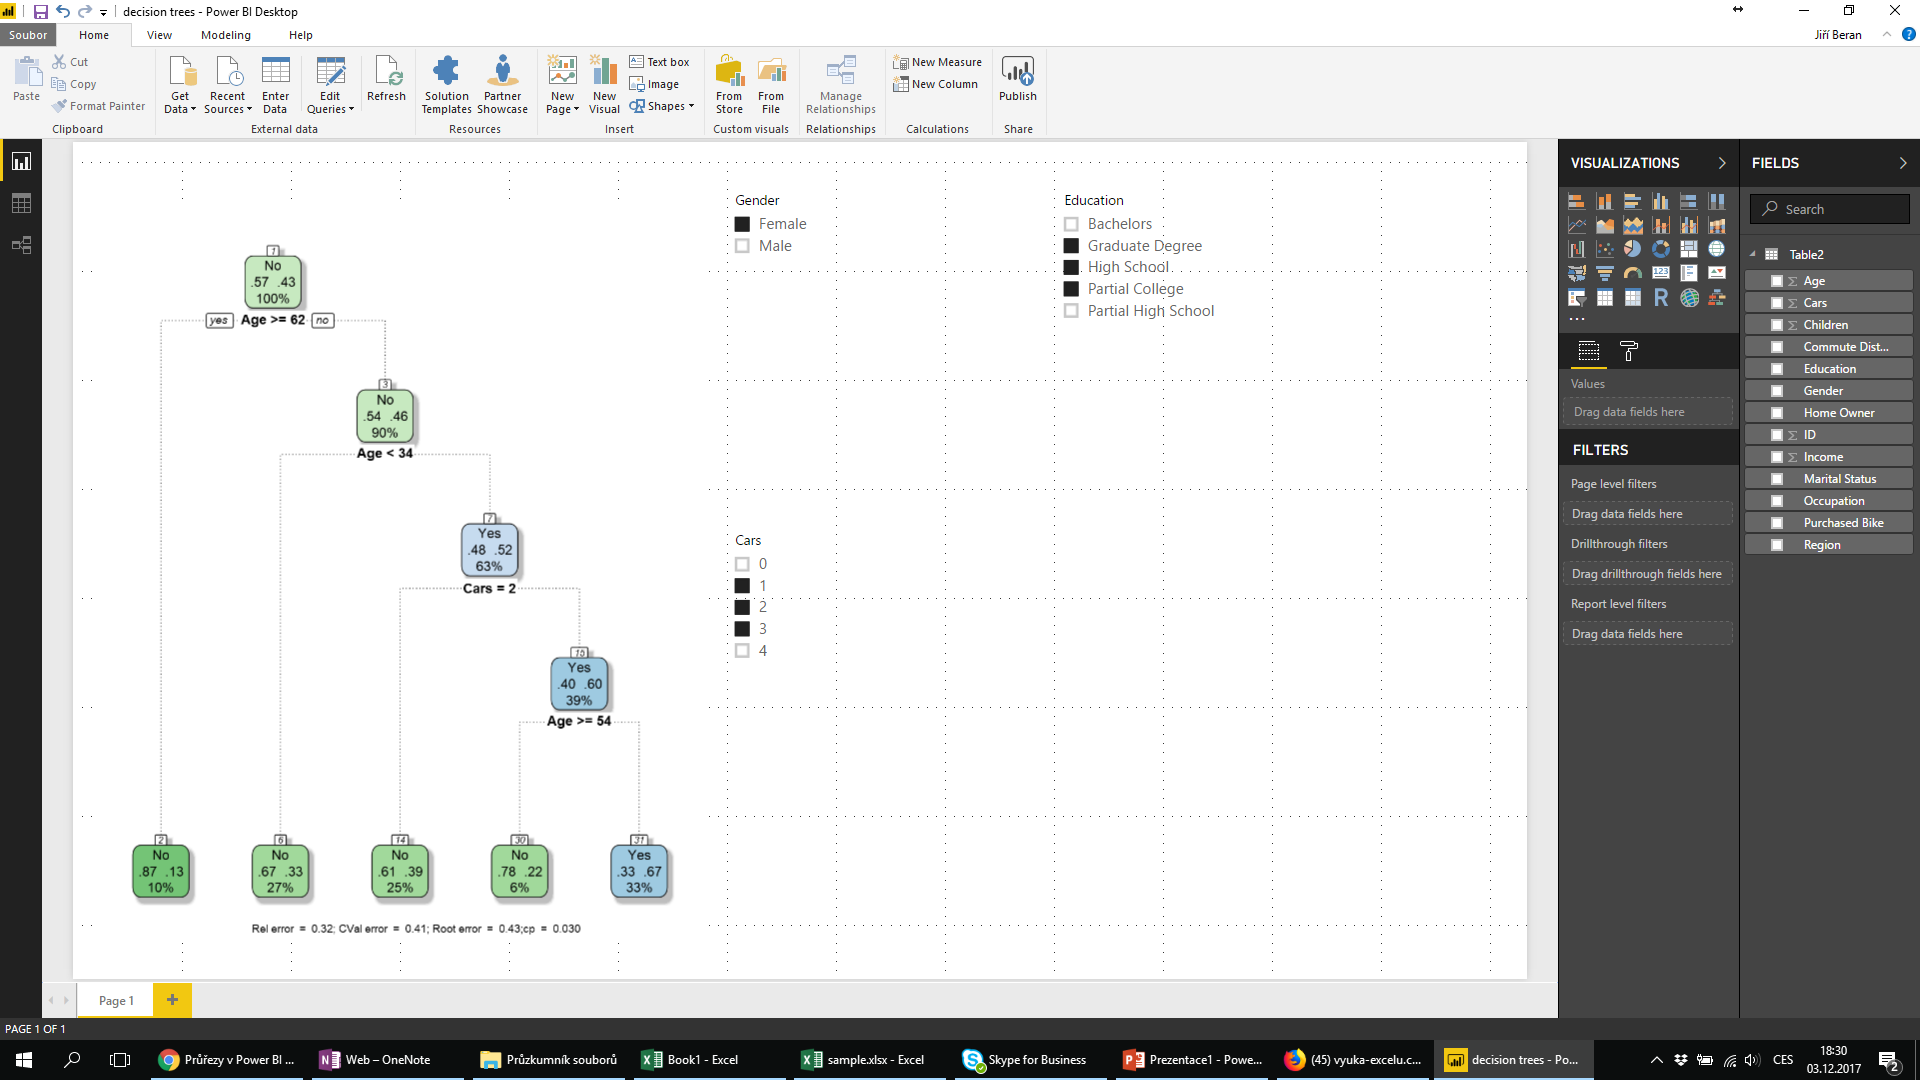
It´s good to know, that every visual, including decision trees, is filtered by other visuals (typically by slicers). So it is very easy to switch the trees for different sex, education, number of cars etc.
![]()
![]()
Pište kdykoliv. Odpovíme do 24h
![]()
© exceltown.com / 2006 - 2023 Vyrobilo studio bARTvisions s.r.o.
How do you construct the excel sheet. I have tried this with my own and it never works and I’m lost as to why. Please help?