Našimi kurzy prošlo více než 10 000+ účastníků
2 392 ověřených referencí účastníků našich kurzů. Přesvědčte se sami
This article describes using of parameters in Power BI. It is about parameters used in DAX, managed from visuals – which is not the same as parameters in queries.
Parameter in DAX is a variable, whose current value can be changed. This changing has direct impact on visuals. It is different from slicers – slicer is a filter and nothing more, parameter can be used for complex what-if analysis.
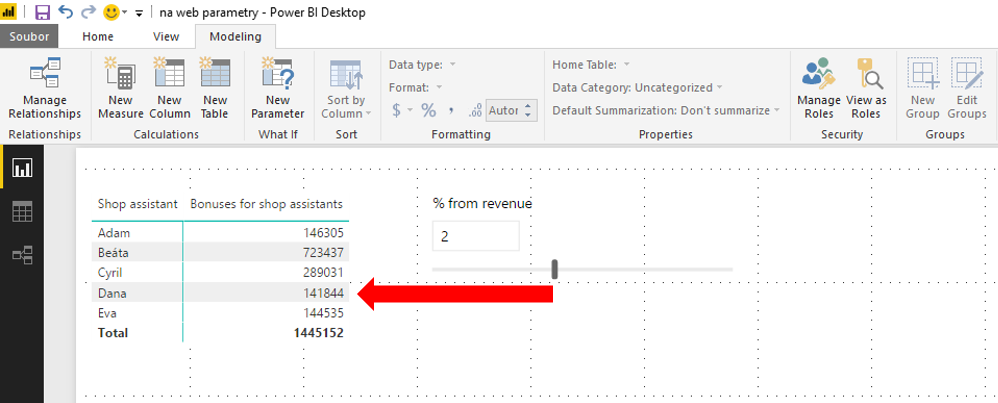
In this example there are five sales assistants, their salary bonuses are calculated as a % from revenue. In a chart we want to try various values of this % and observe the size of bonuses for this %. I mean the size of bonuses for 1%, 2%, 3%…
How to do it? We have to 1) create parameter, 2) use this parameter in some measure calculation 3) use this measure in some visual.
Let´s create the parameter and define it.
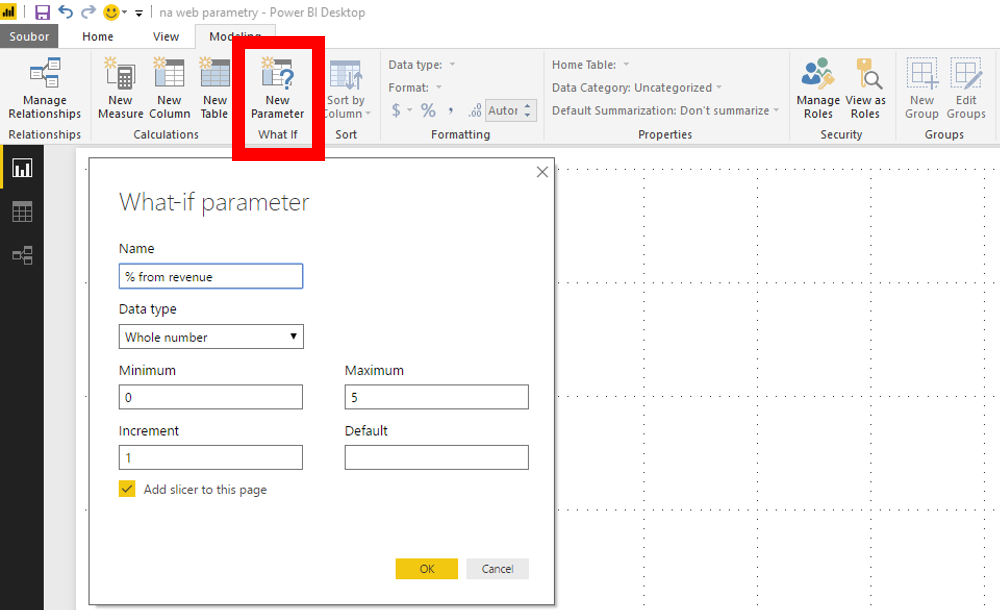
This parameter has to be used in some measure (it is not working for column calculation). Here we have revenue, which will be multiplied by parameter (%) and divided by 100.

Now let´s create new chart or table, that contains this measure. Parameter itself has to be used in slicer – but this will be probably done automatically when parameter is created.
That´s all. Now changing of values changes the values of visuals. You can download this example from here.
![]()
![]()
Pište kdykoliv. Odpovíme do 24h
![]()
© exceltown.com / 2006 - 2023 Vyrobilo studio bARTvisions s.r.o.