Našimi kurzy prošlo více než 10 000+ účastníků
2 392 ověřených referencí účastníků našich kurzů. Přesvědčte se sami
This, really short, manual is about creating of Pivot Tables in Power BI. Actually, it is very similar to Pivot tables in Excel.
Lets work with this sales data:
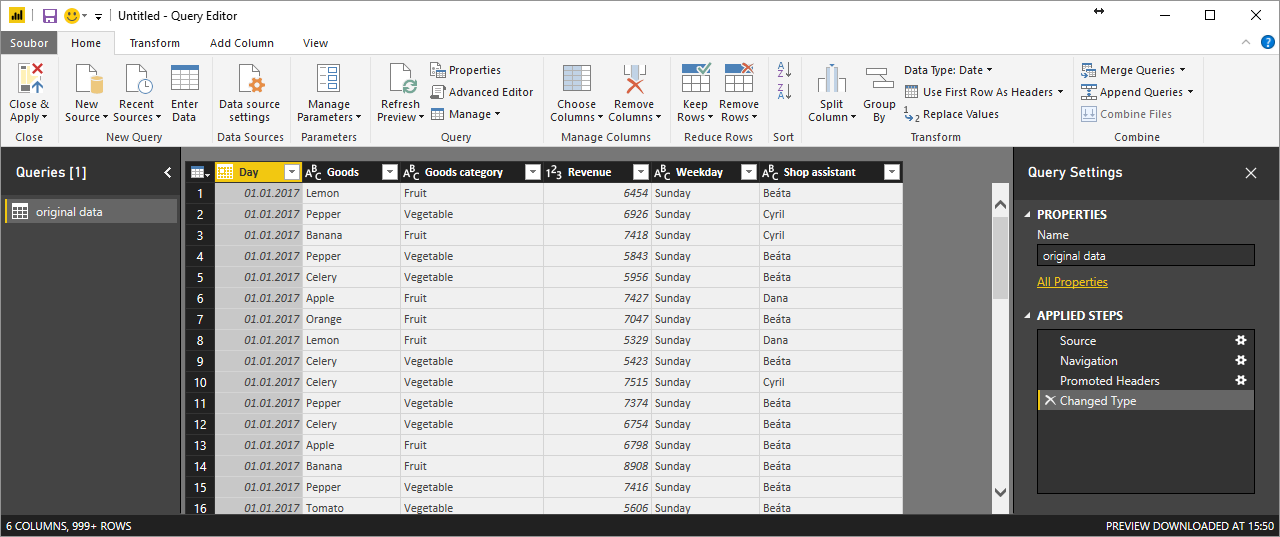
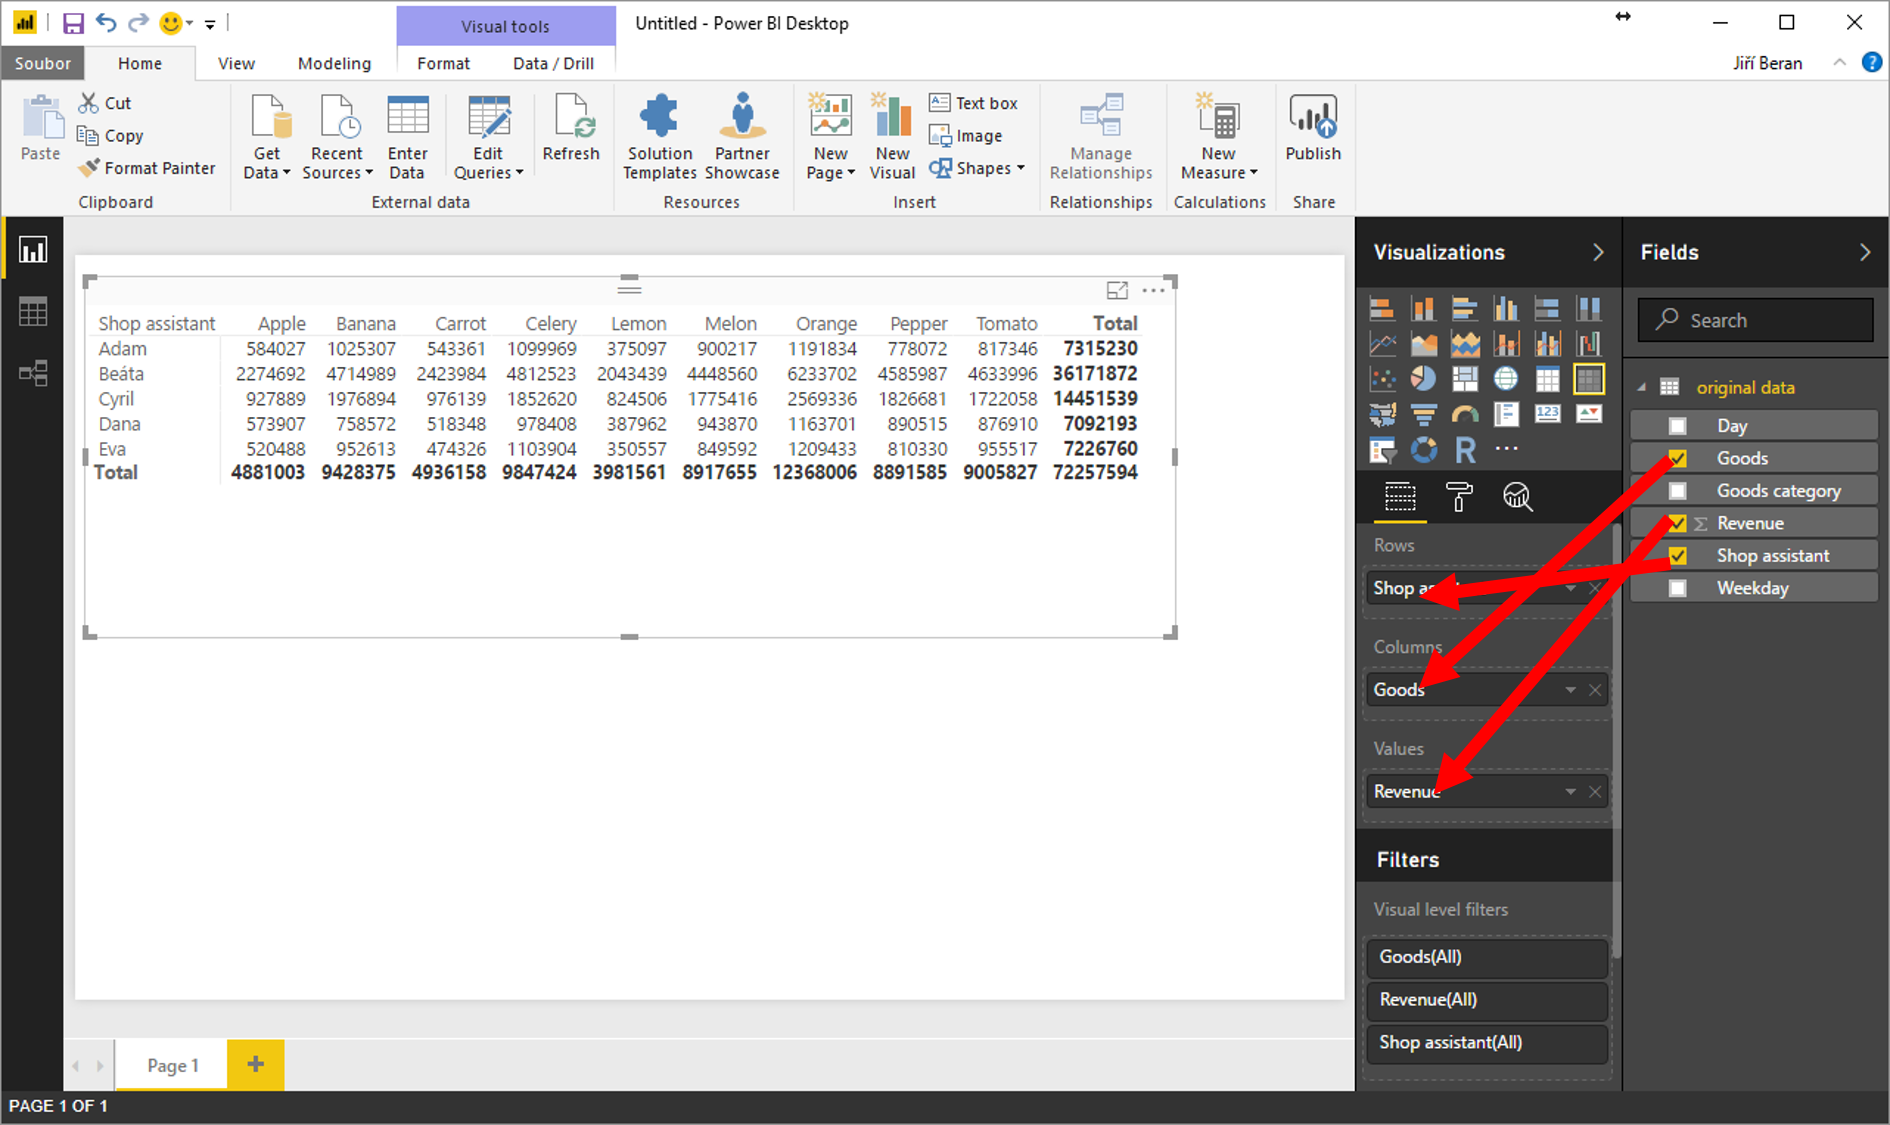
Insert a new visual called Matrix. Add the items to Rows, Columns and Values – the same way you do it in Excel.
![]()
![]()
Pište kdykoliv. Odpovíme do 24h
![]()
© exceltown.com / 2006 - 2023 Vyrobilo studio bARTvisions s.r.o.
That is called “repivoting” data and is NOT a pivot table. A user cannot move dimensional data from rows to columns and visa versa nor can they nest a hierarchy. Very deceiving.
How to sort this by column. Only thing why Im not using PowerBI