Našimi kurzy prošlo více než 10 000+ účastníků
2 392 ověřených referencí účastníků našich kurzů. Přesvědčte se sami
For most of businesses, the statistics from website traffic are crucial. In Power BI you can not only see them, but combine with another data and evaluate them in context as well. So how to do it?
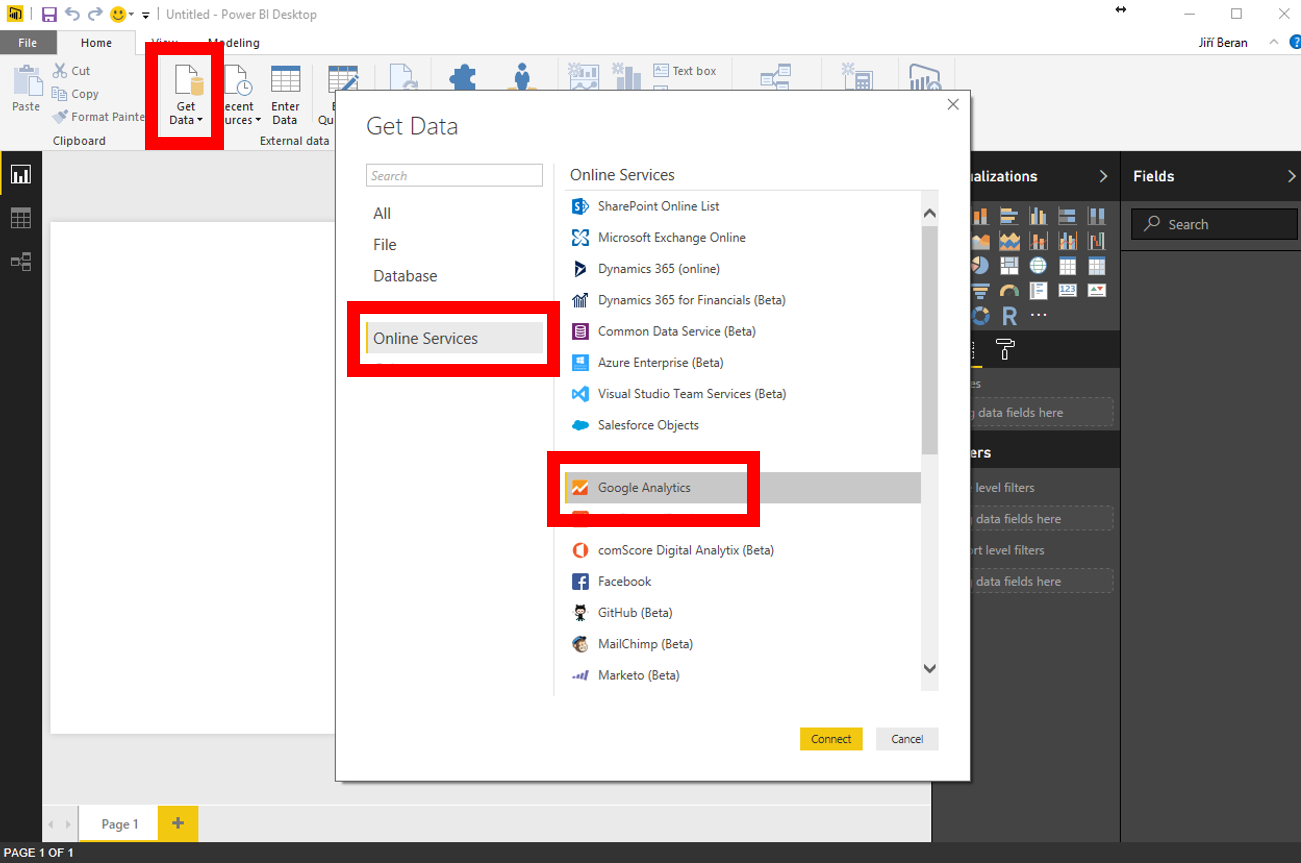
We are working in Power BI Desktop. Let´s connect to Google Analytics.
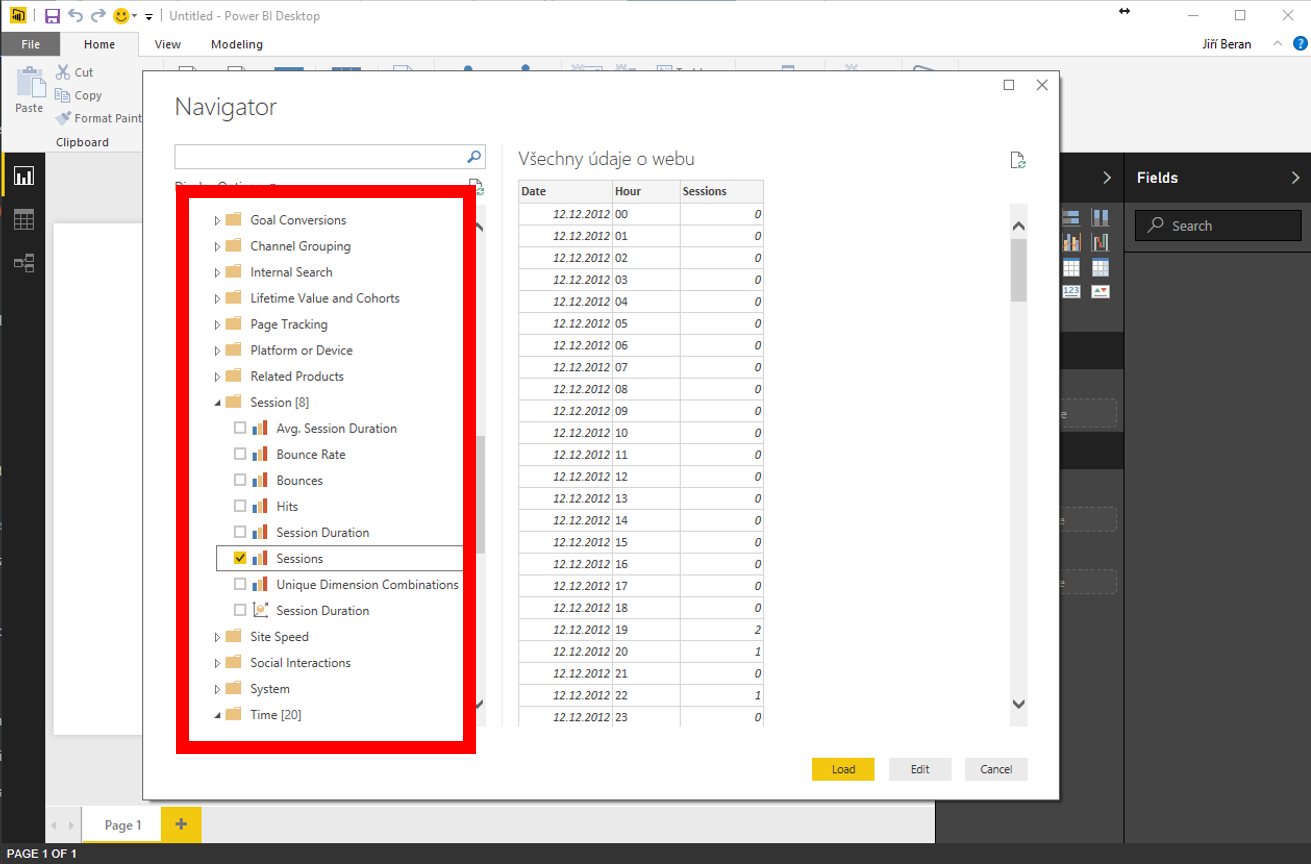
Select the web you are interested in. Select the dimensions (groupings for reports), for example “Date” and “Hour” in “Time” dimension.

then select some metrics (values to observe). For example “Sessions” in “Session” group.
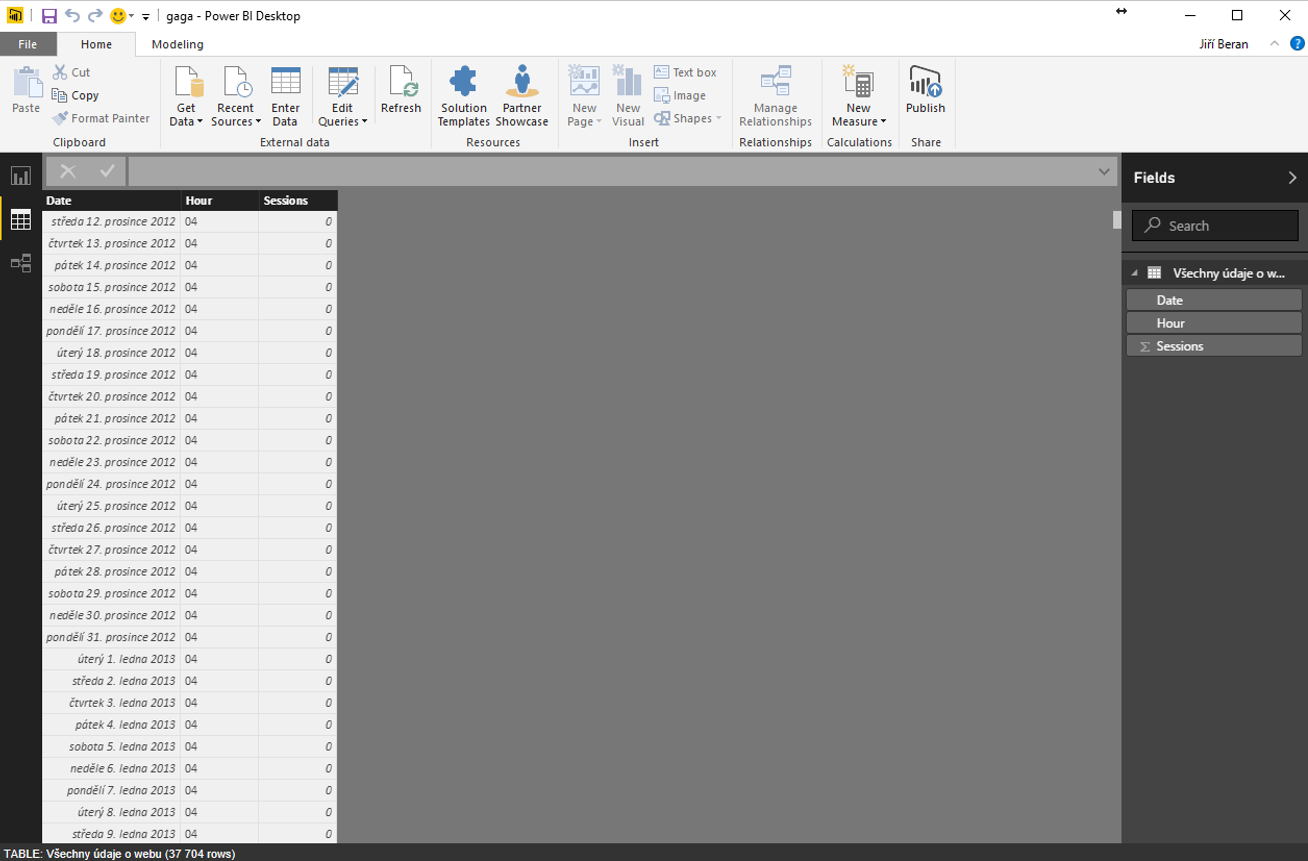
Load the data. Then you can not only show the data very simply::
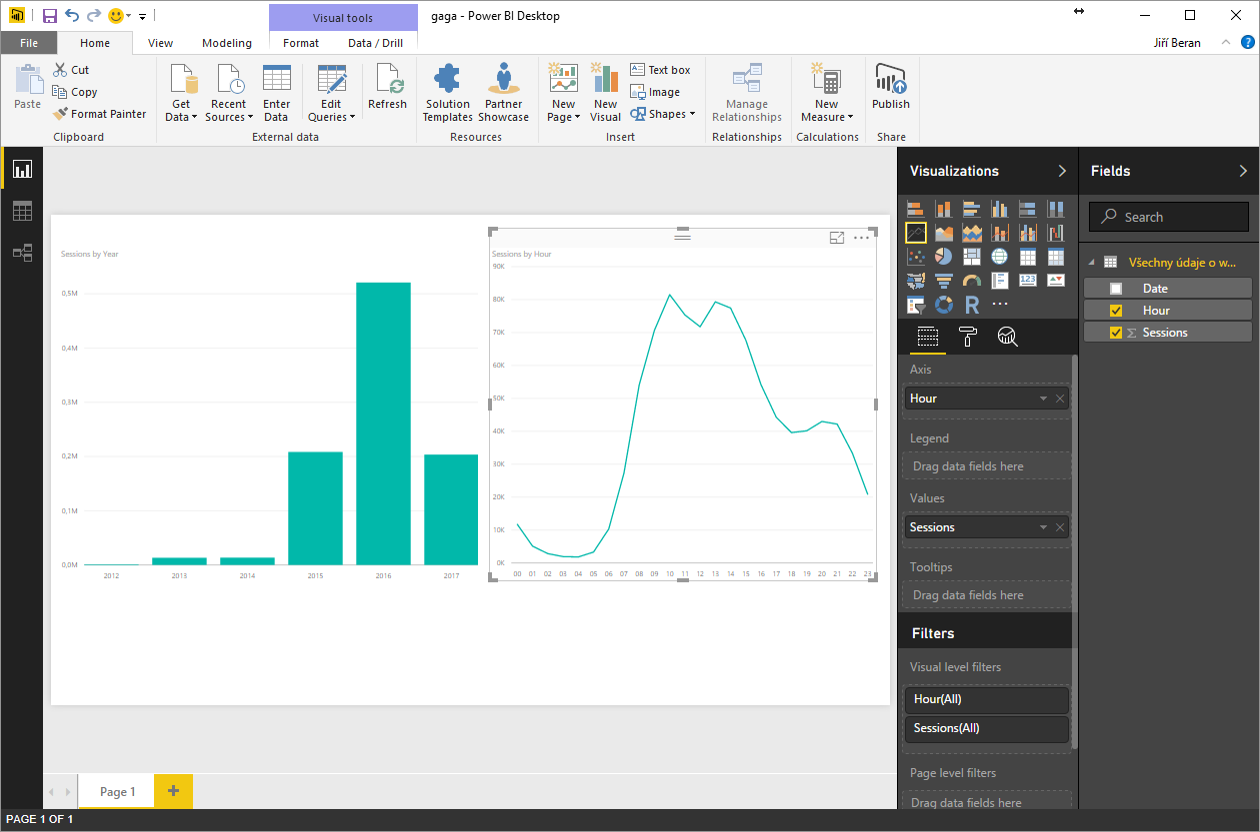
but create nice visualizations as well:
This is how it looks like after publishing to web. You can check the interactivity of report.
Click here to see how connect data from Google Analytics with other corporate data.
![]()
![]()
Pište kdykoliv. Odpovíme do 24h
![]()
© exceltown.com / 2006 - 2023 Vyrobilo studio bARTvisions s.r.o.