Našimi kurzy prošlo více než 10 000+ účastníků
2 392 ověřených referencí účastníků našich kurzů. Přesvědčte se sami
This article is about simple calculation of parameters of linear regression in R script.
If you are interested in linear regression in Excel, click here.
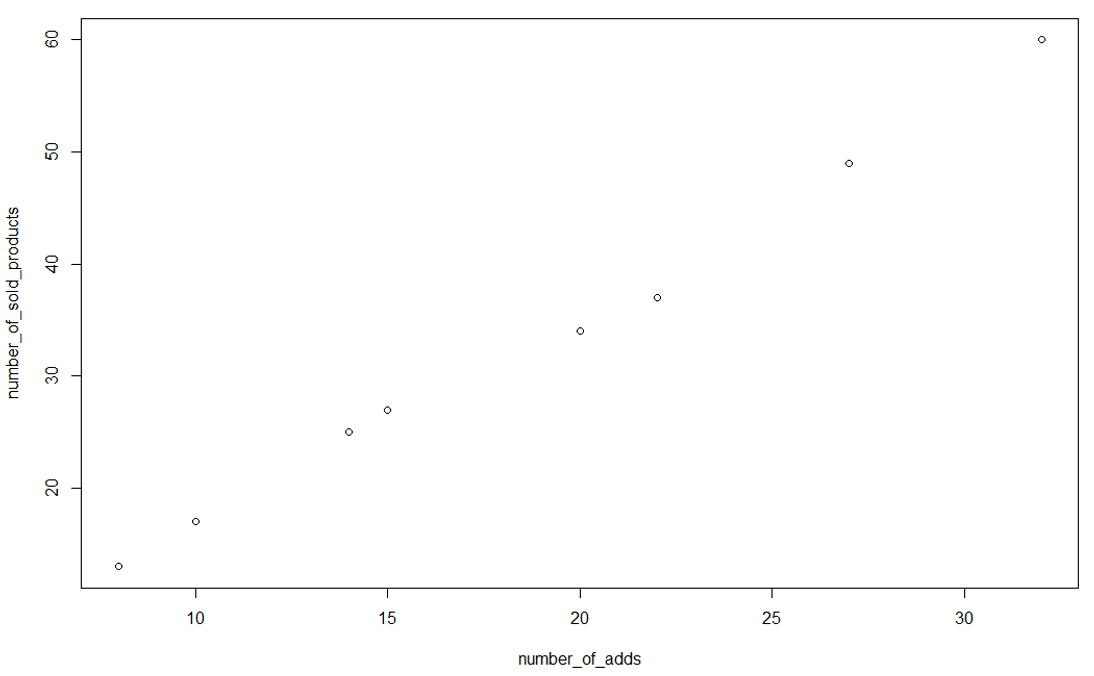
Let´s start with data uploading. In this example we will observe the dependency of sales on number of adds.
number_of_adds = c(10,15,22,8,14,20,32,27)
number_of_sold_products = c(17,27,37,13,25,34,60,49)
Create a data frame from vectors:
mydata=data.frame(number_of_adds,number_of_sold_products)
Create a linear model from data frame.
mymodel = lm(number_of_sold_products ~ number_of_adds, data = mydata)
Now you can show the model and its parameters:
print(mymodel)
Coefficients:
(Intercept) number_of_adds
-2.377 1.899
You can also draw it:
plot(mydata)
What does the results mean?
![]()
![]()
Pište kdykoliv. Odpovíme do 24h
![]()
© exceltown.com / 2006 - 2023 Vyrobilo studio bARTvisions s.r.o.