Našimi kurzy prošlo více než 10 000+ účastníků
2 392 ověřených referencí účastníků našich kurzů. Přesvědčte se sami
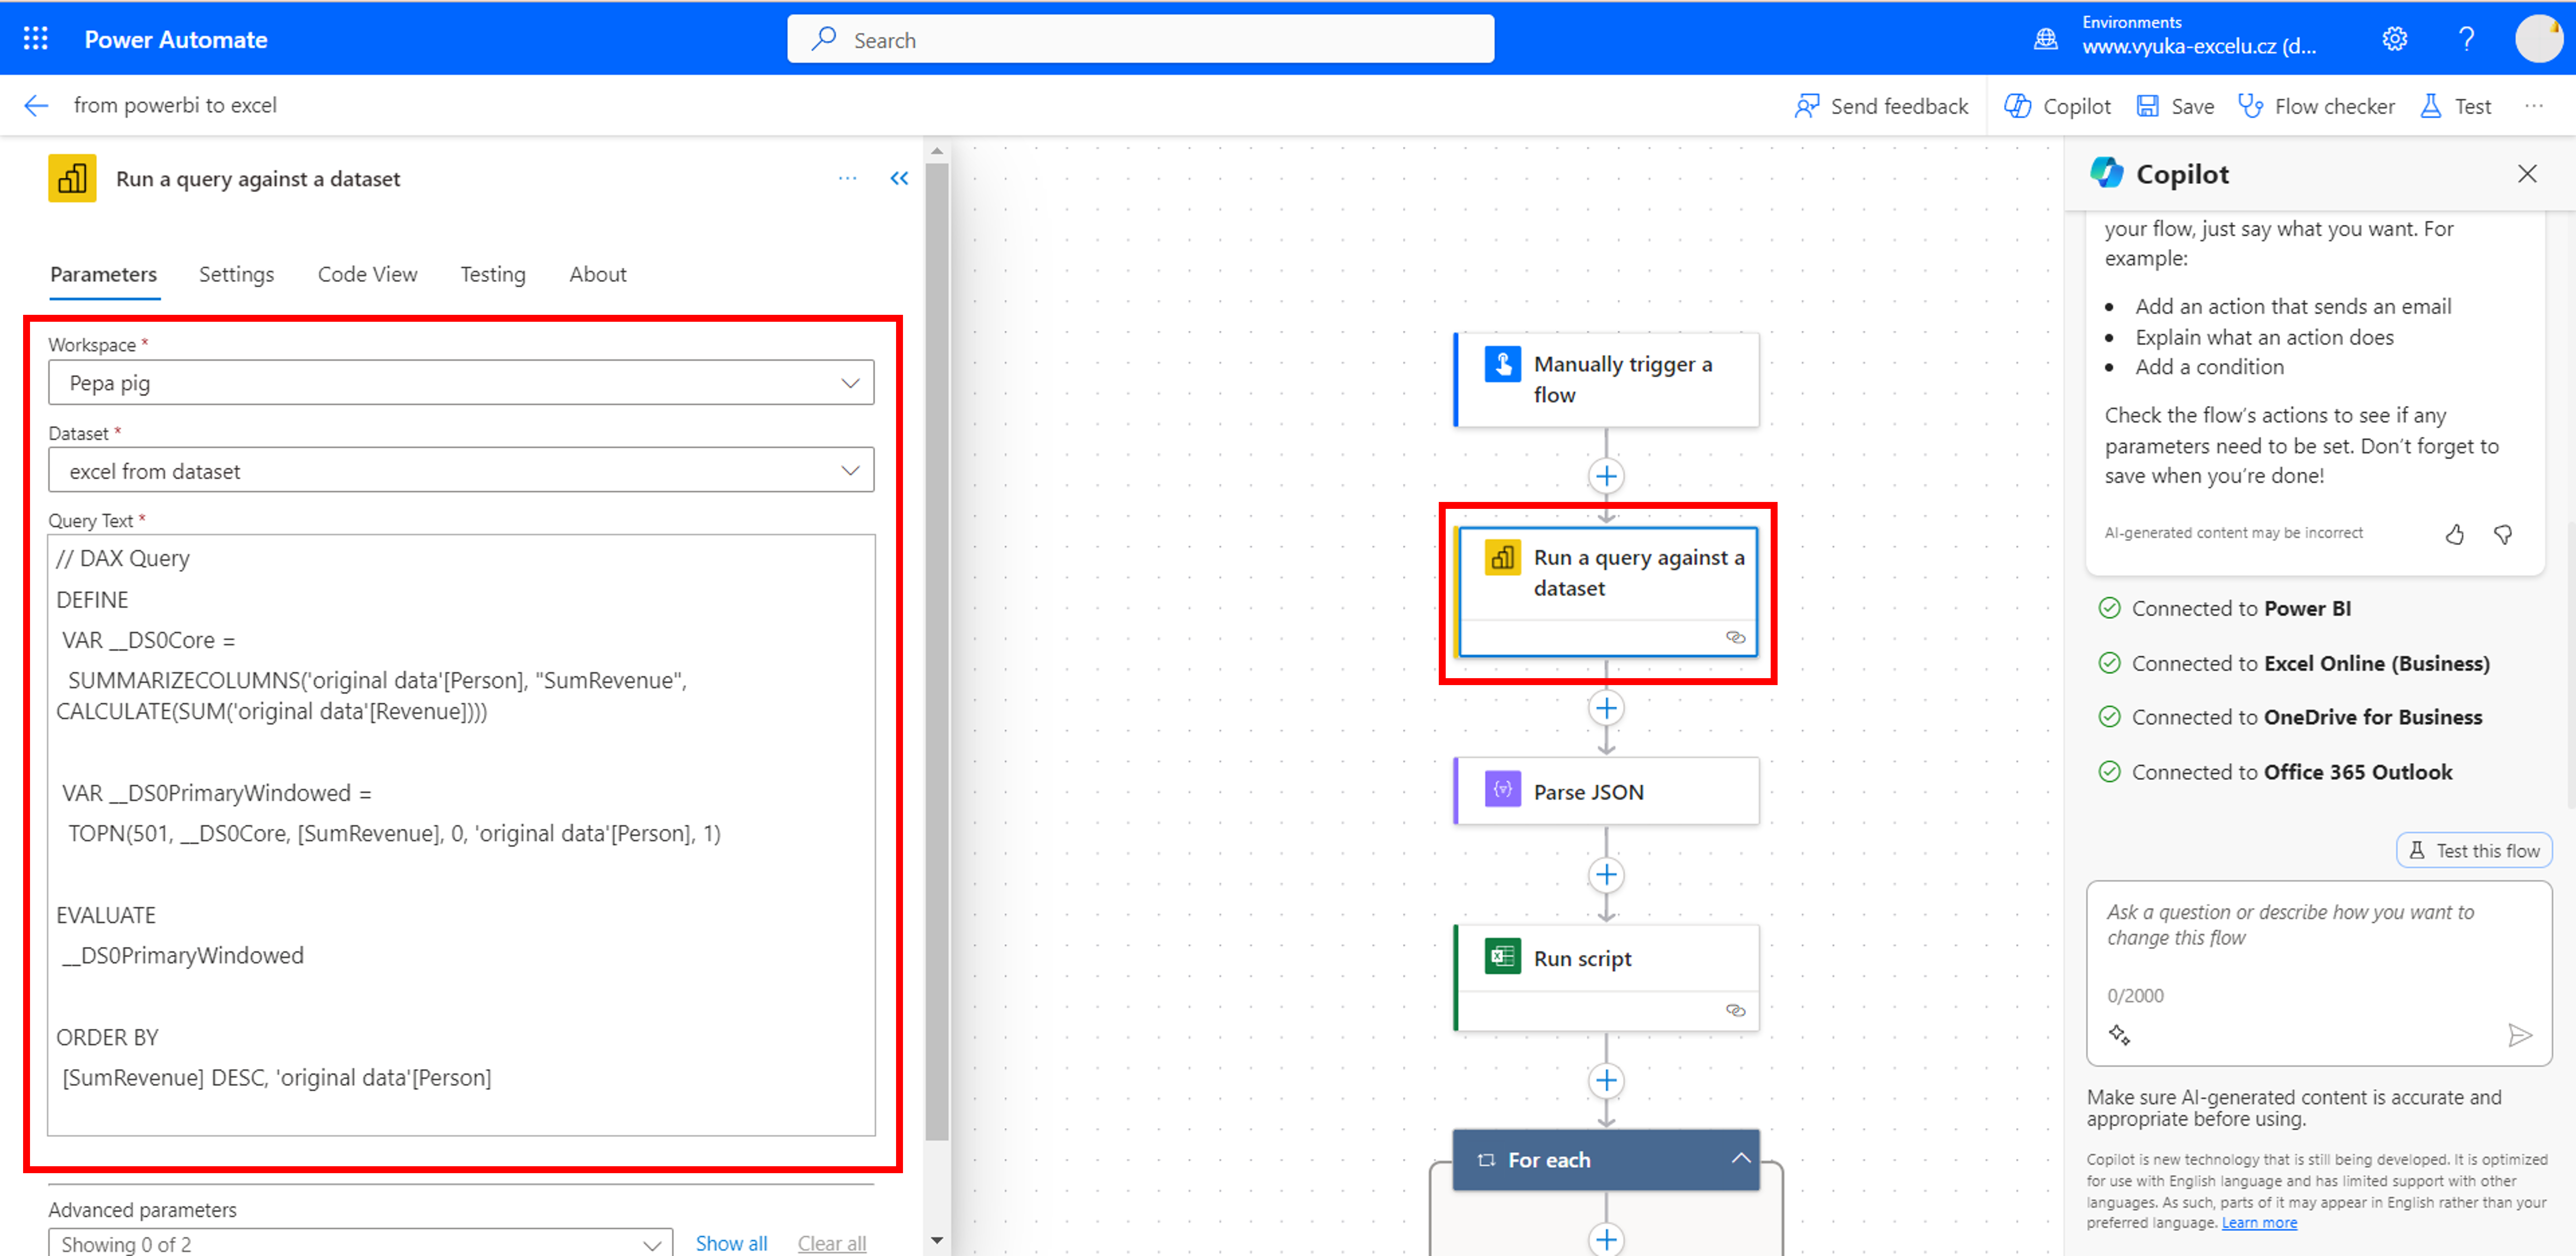
This tutorial shows saving of Power BI visual content into a xlsx file, using Power Automate.
Let´s say you have visual like this:
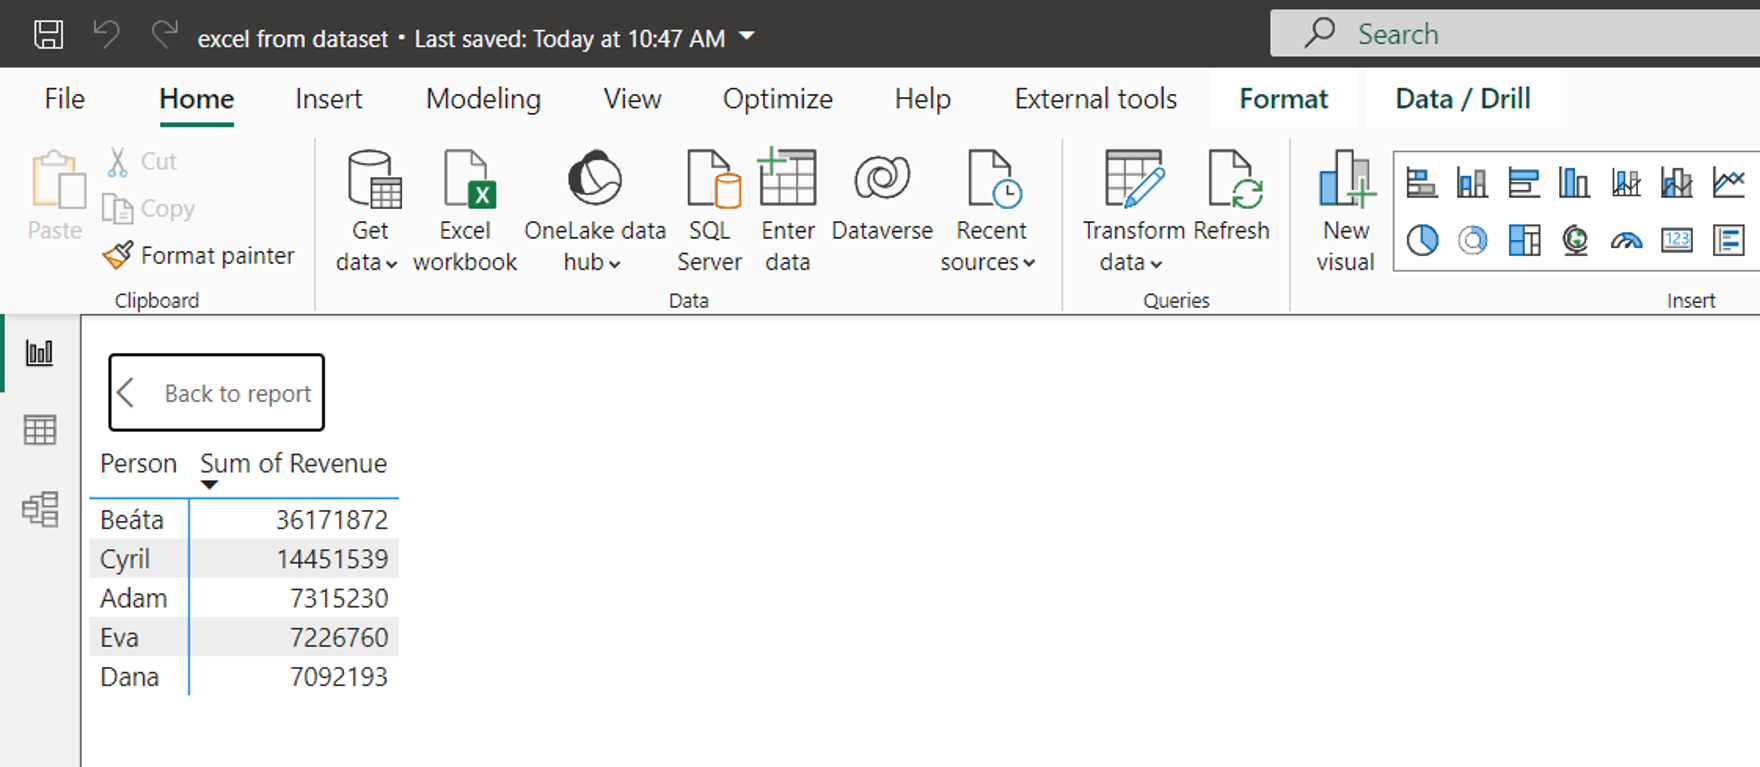
You don´t have to write the DAX code – just generate it automatically in Desktop, using Performance analyzer.
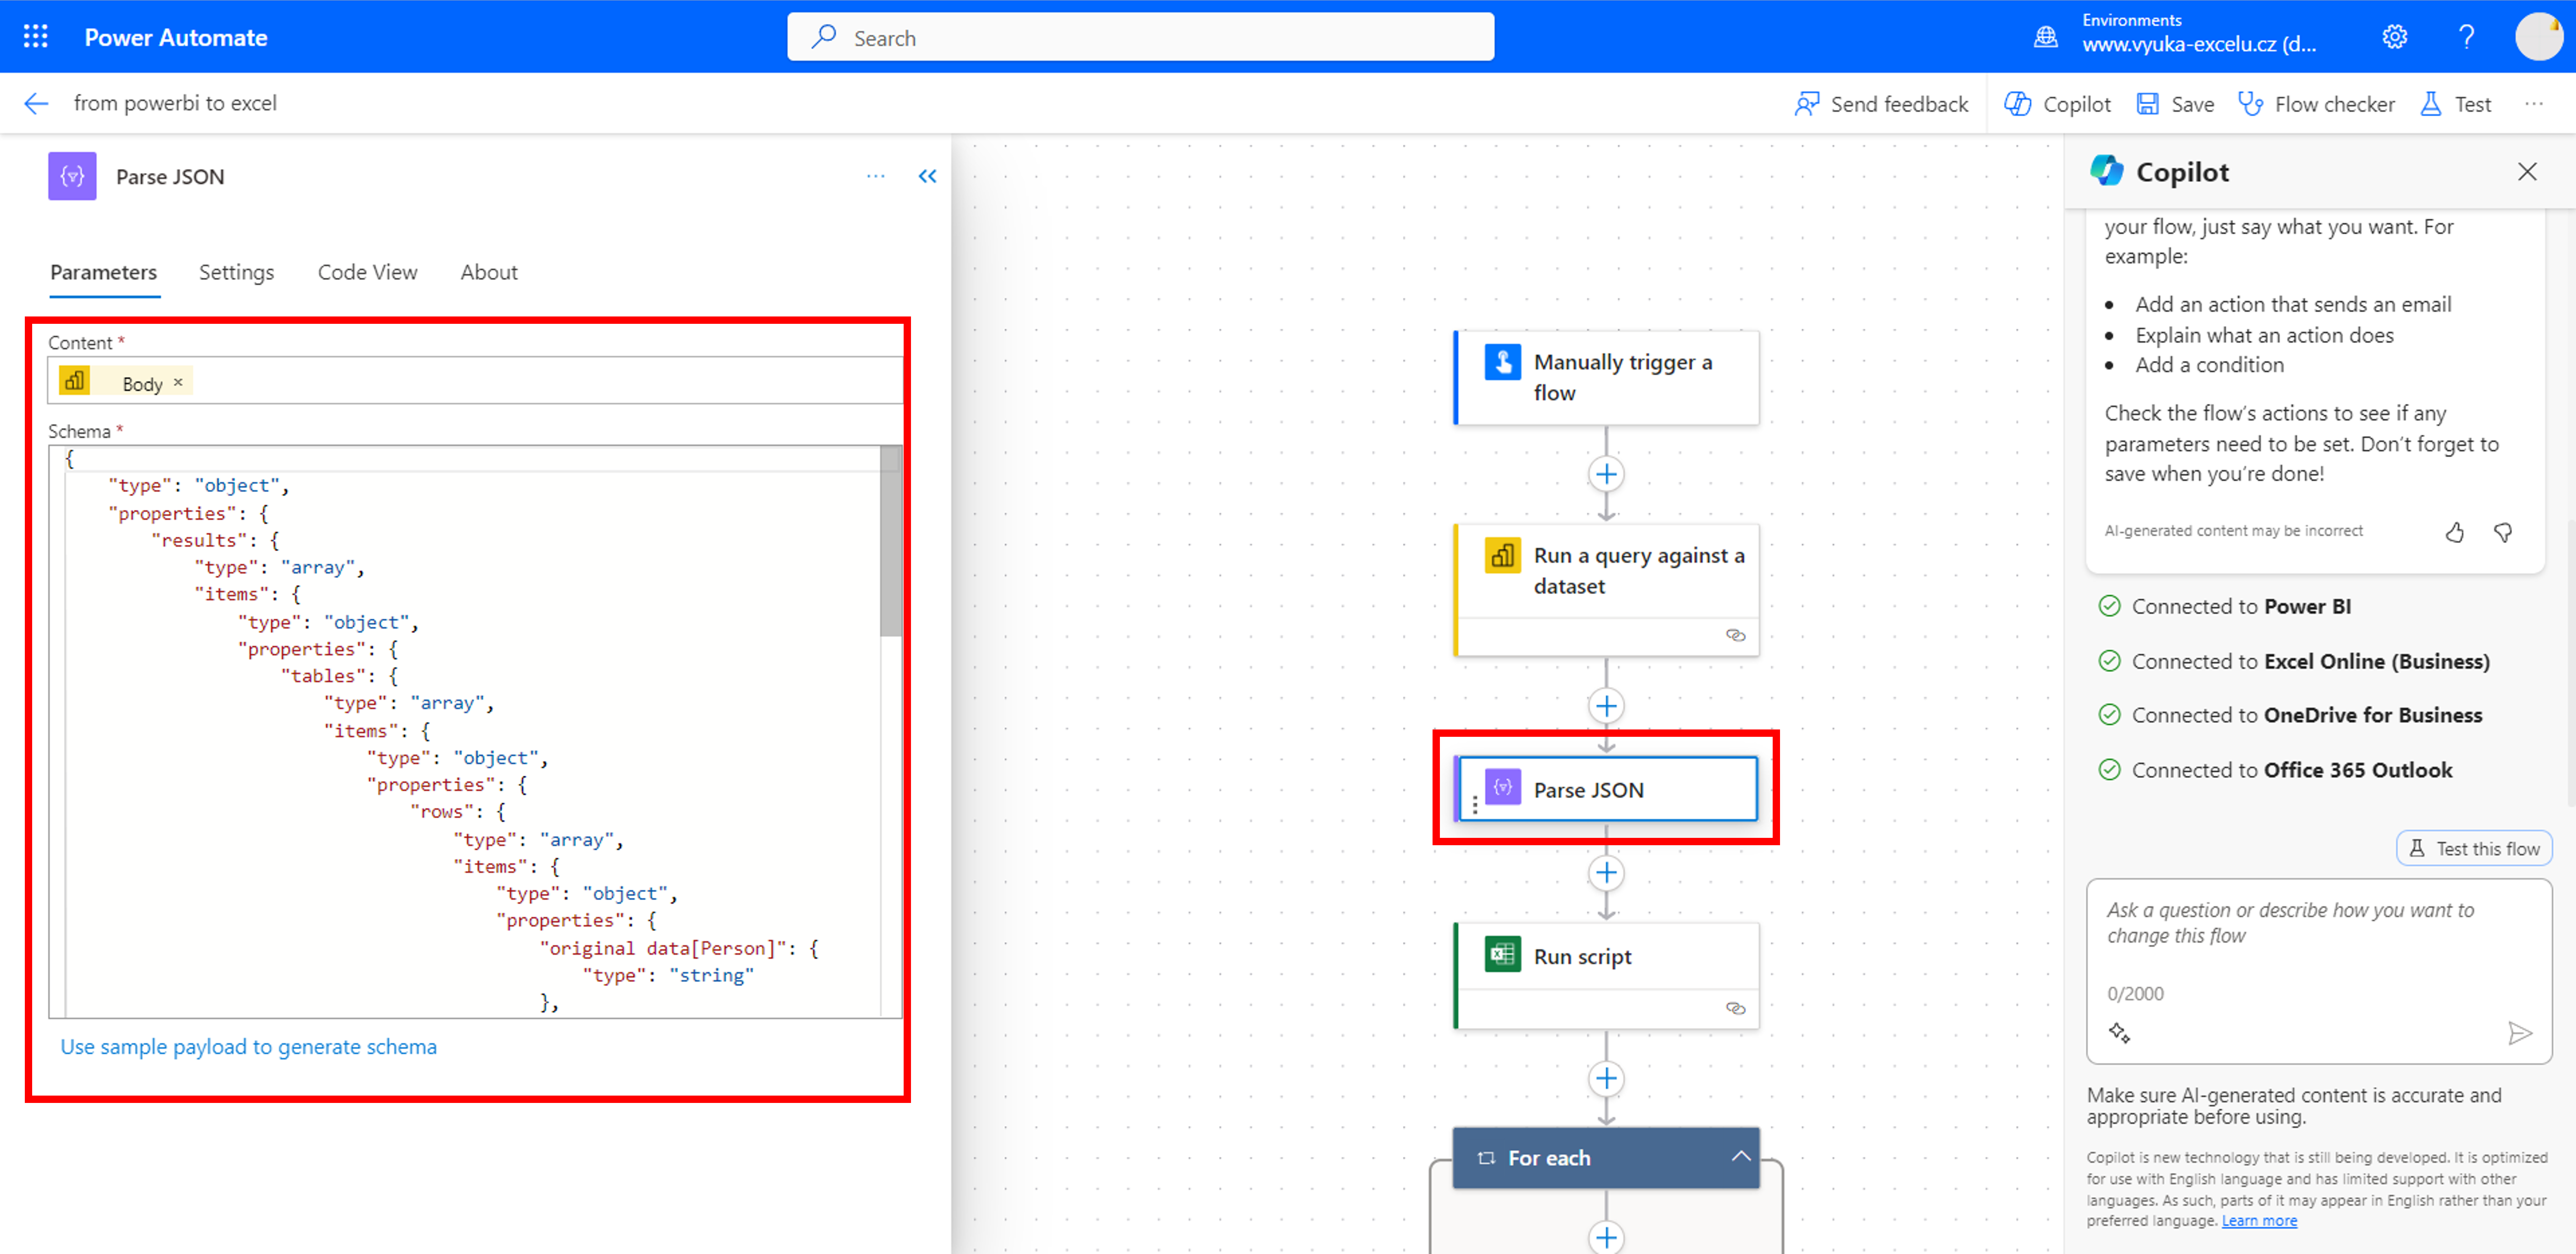
The Parse JSON gets specific information from table, so as you can work with them easy. Here you can read how to do it in a minute.
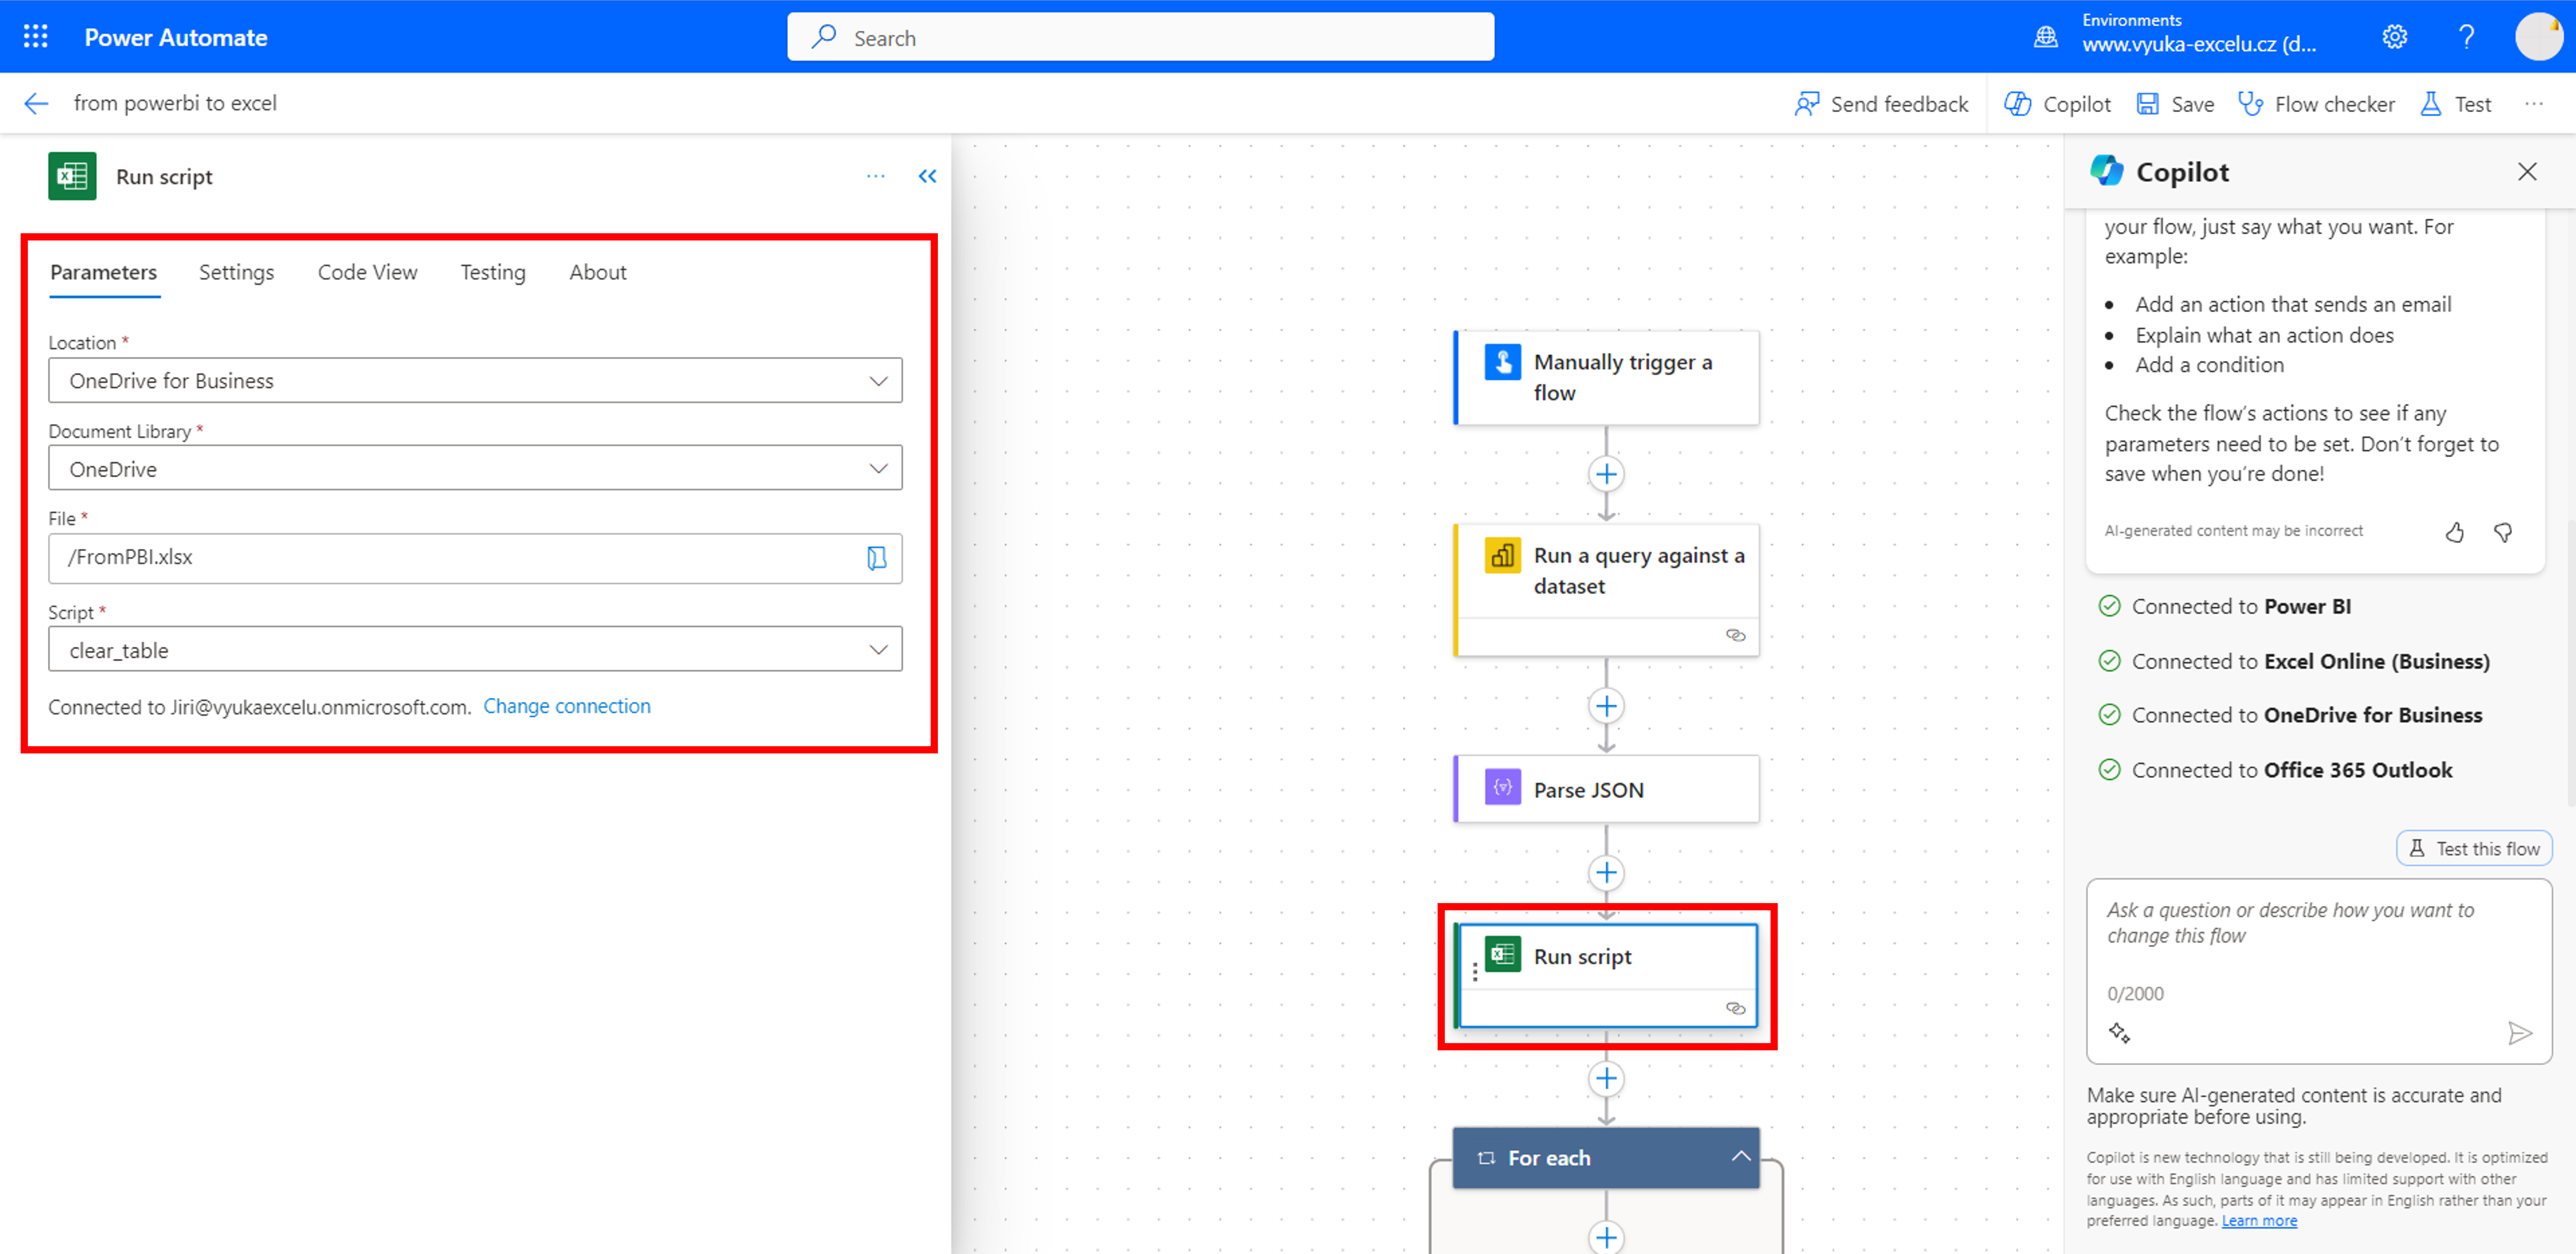
Before adding new rows into a table, let´s delete the previous content. Office Script can be very handful.
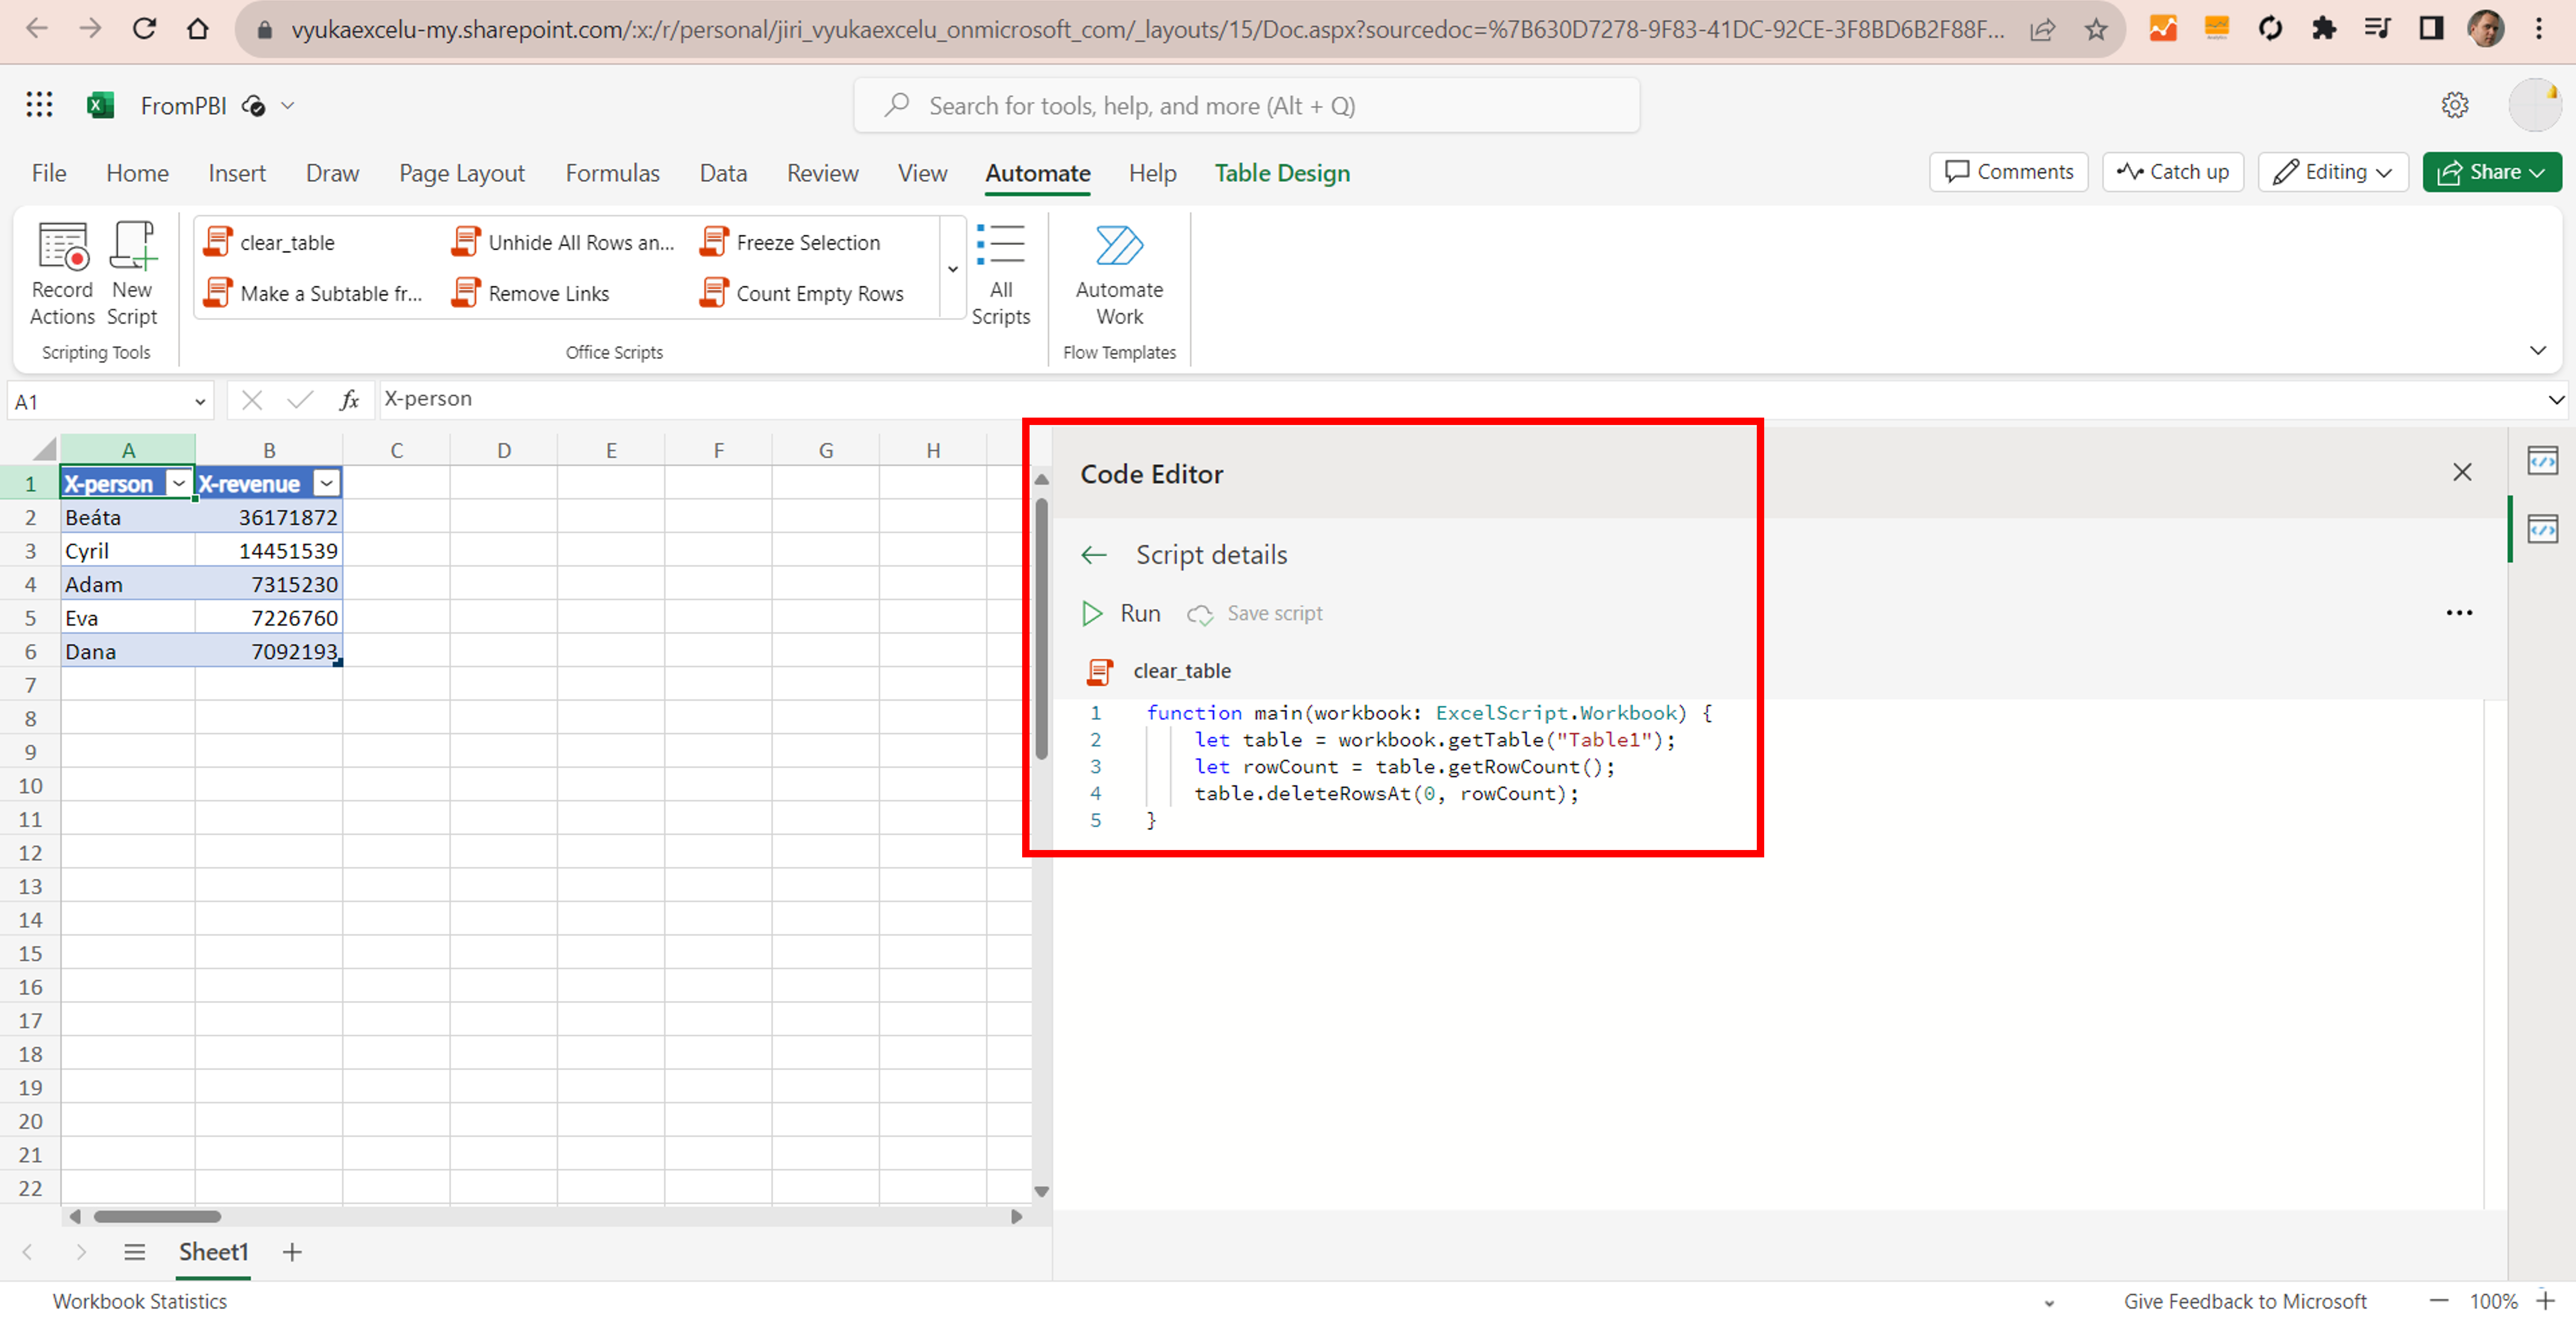
The script is triggered from Power Automate.
The table can be filled, row by row, by Power BI action (or by Office Script, for example…).
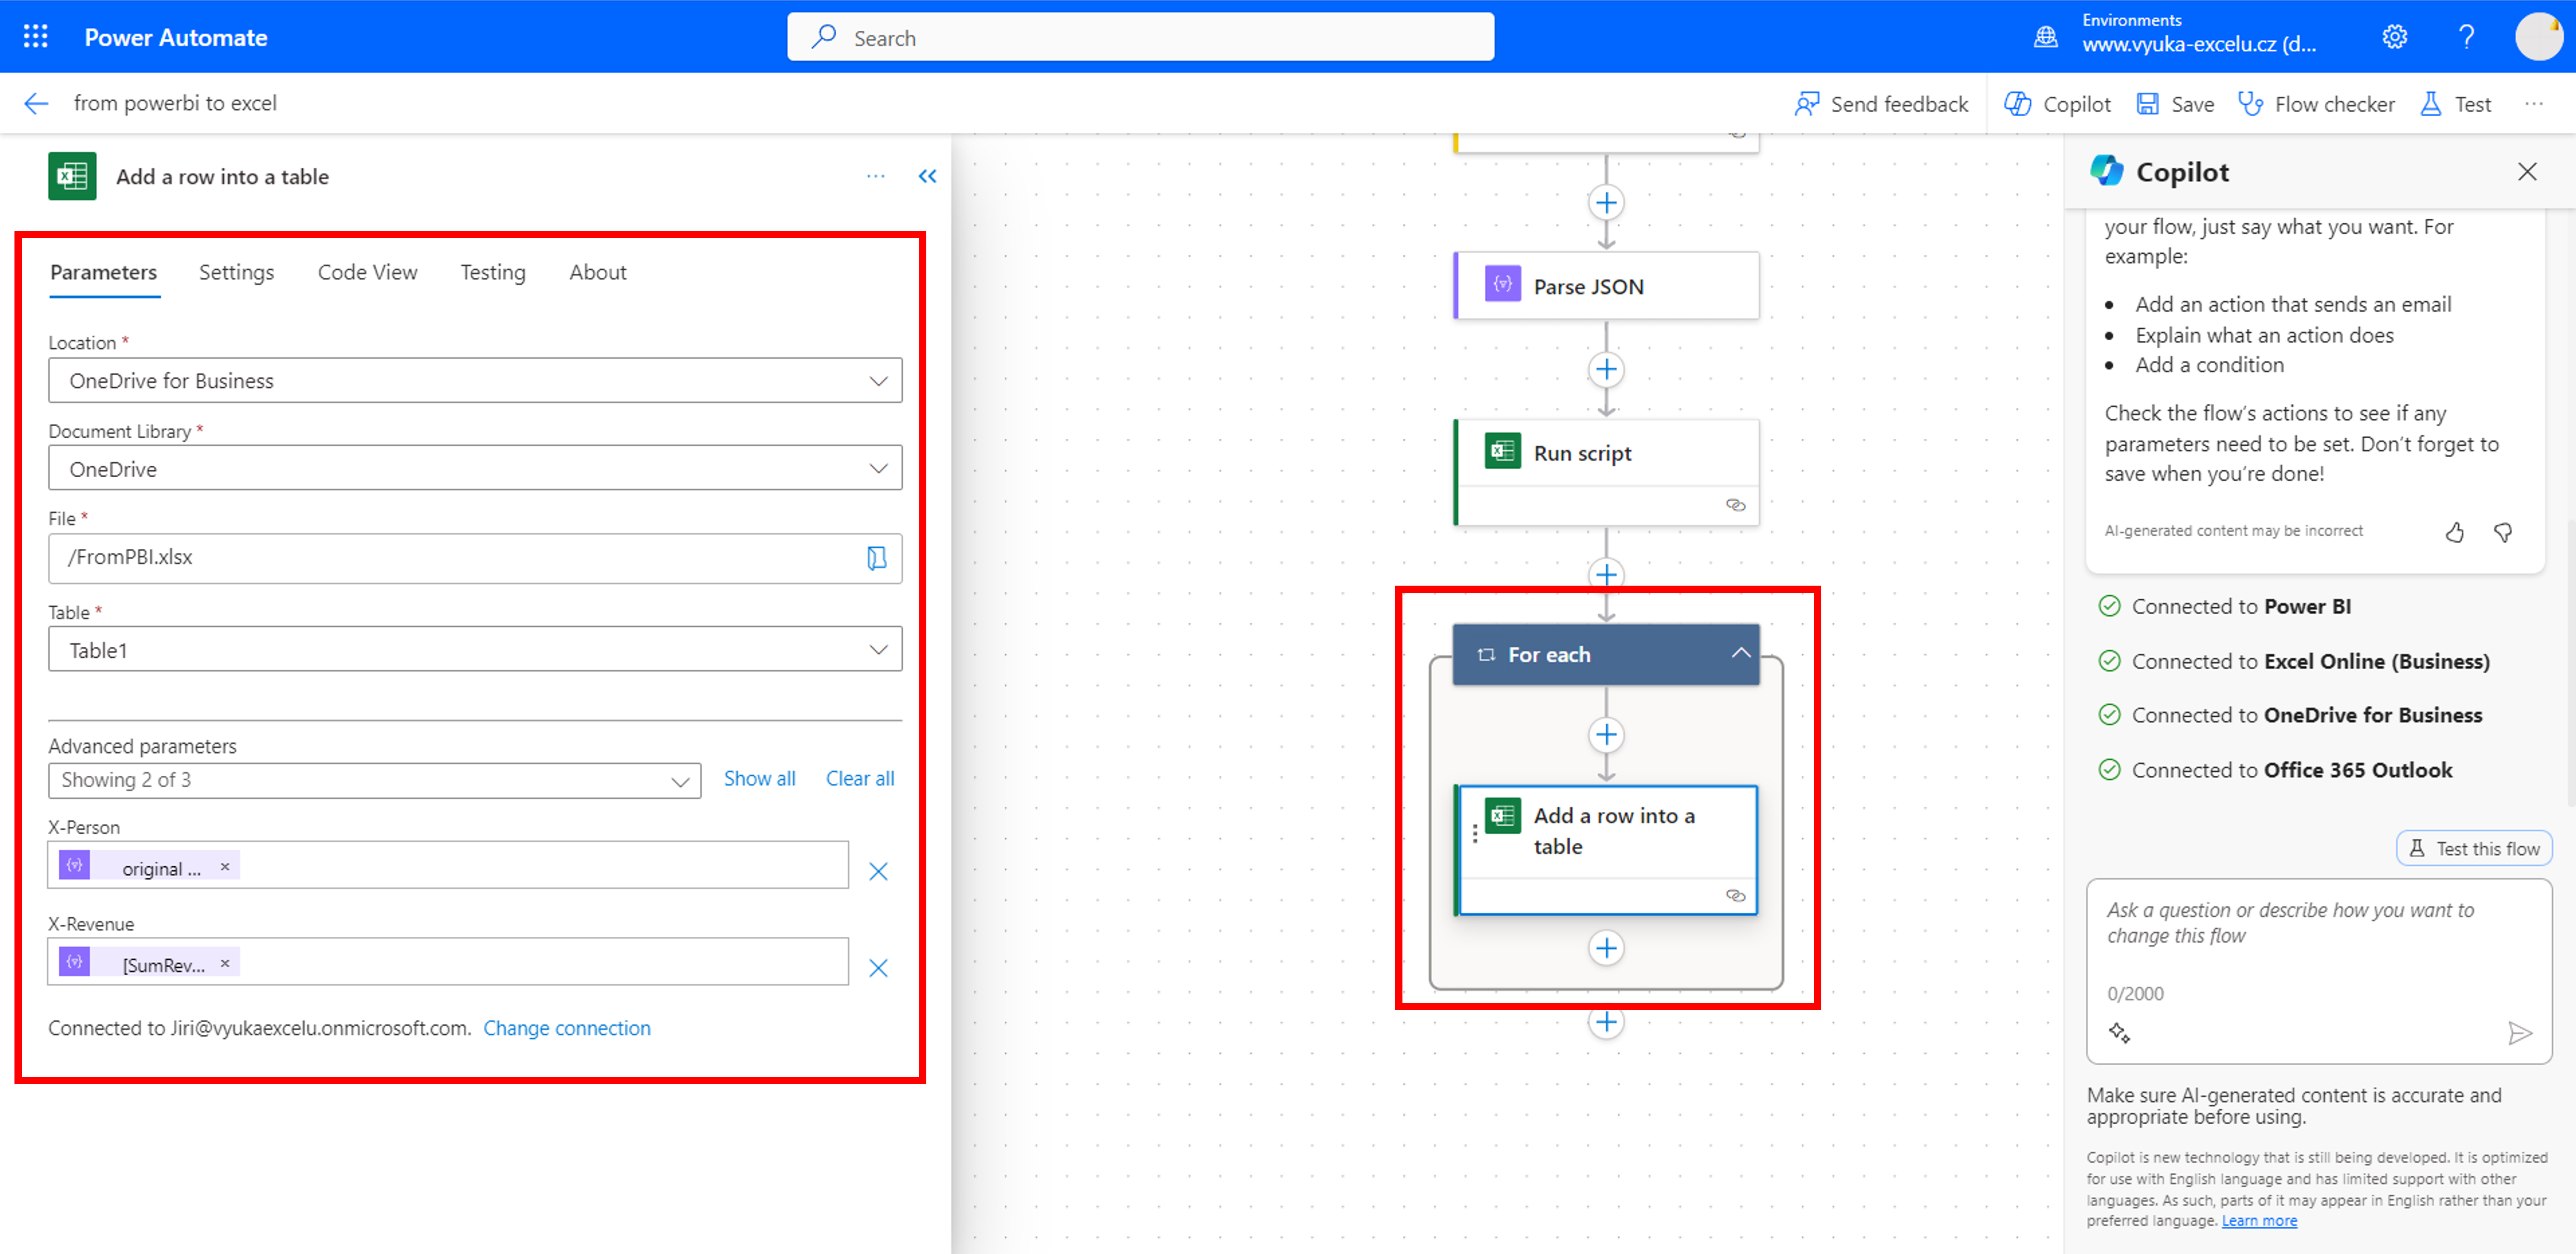
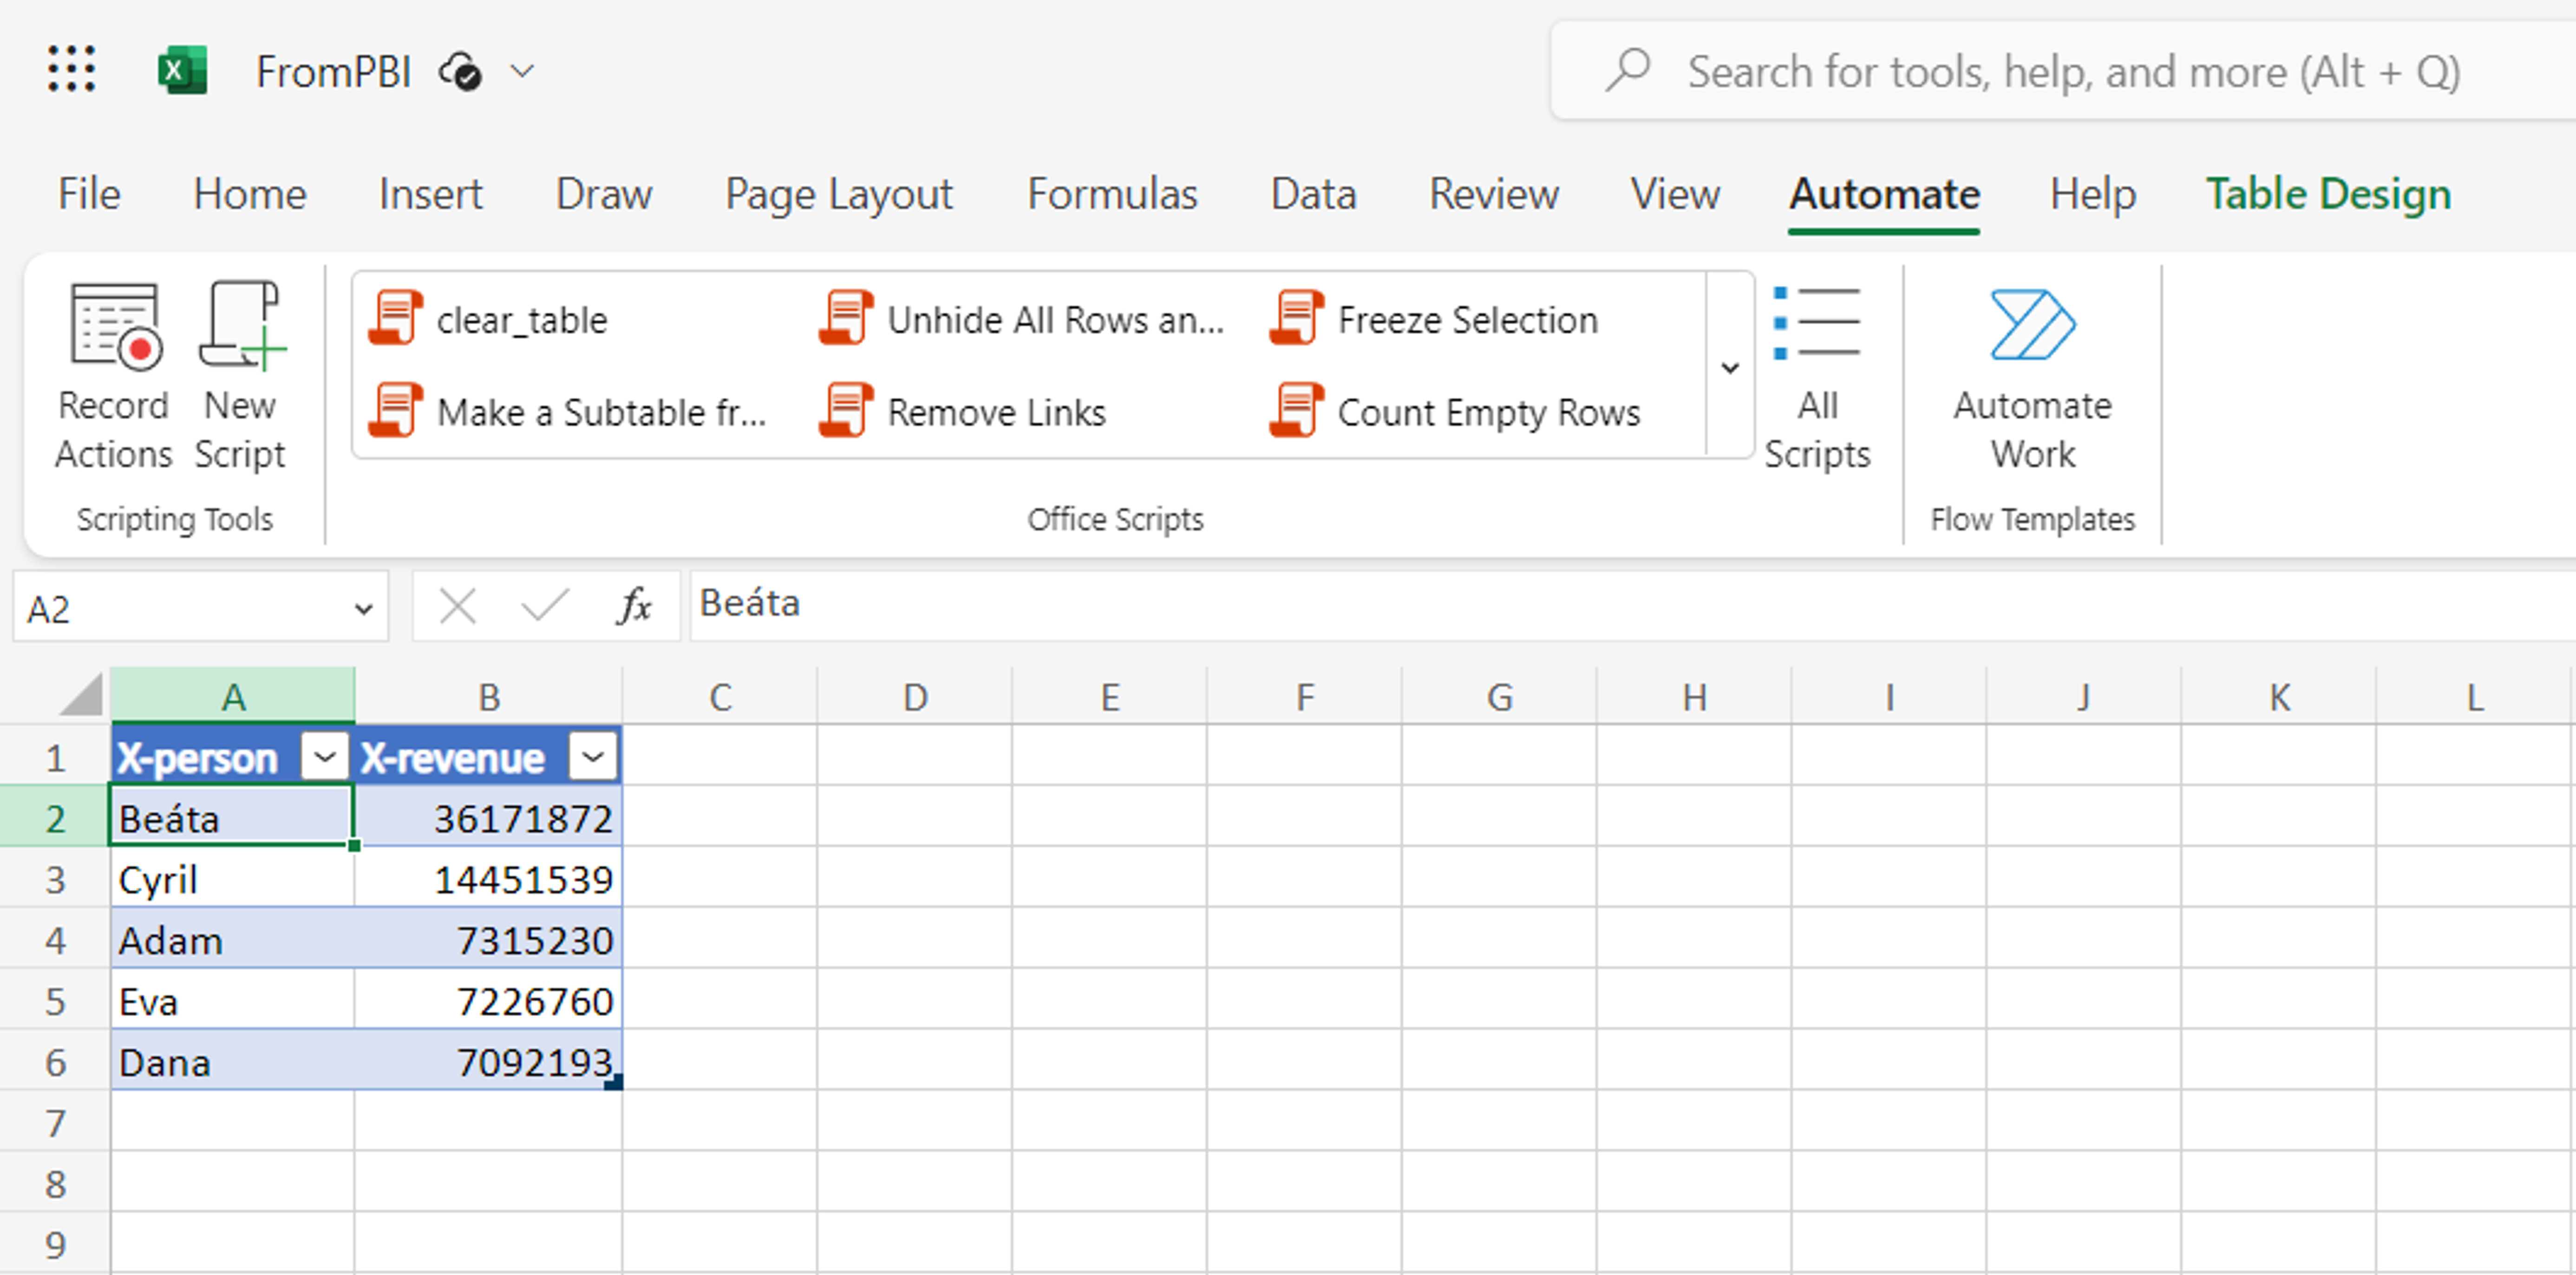
Which puts the content of visual into a table:
![]()
![]()
Pište kdykoliv. Odpovíme do 24h
![]()
© exceltown.com / 2006 - 2023 Vyrobilo studio bARTvisions s.r.o.